Kafka Consumer Lag Monitoring
The cheapest signal you have for a stuck Kafka consumer. Measure it, alert on it, and stop running a Prometheus stack just to read one number.
What Kafka consumer lag actually is
Consumer lag is the number of messages a consumer group still has to read on a partition. For partition p, lag is LogEndOffset(p) − CommittedOffset(group, p). It is reported per partition; the lag of a group is the sum across the partitions it owns.
It's the most direct answer to "is my pipeline keeping up?". A flat non-zero lag is fine — the consumer is steady-state behind. Lag that climbs and never drains means the consumer is backed up. Zero lag is ambiguous: the consumer is either caught up, the topic is idle, or the consumer is dead. You can't tell from lag alone, so watch LogEndOffset rate alongside it.
Measuring lag with the Kafka CLI
Kafka ships kafka-consumer-groups.sh. Run it against any group to see the lag per partition:
bin/kafka-consumer-groups.sh \
  --bootstrap-server localhost:9092 \
  --describe --group payments-processor

# GROUP               TOPIC     PARTITION  CURRENT-OFFSET  LOG-END-OFFSET  LAG    CONSUMER-ID  HOST           CLIENT-ID
# payments-processor  payments  0          15243           15243            0     consumer-1   /10.0.1.4      worker-1
# payments-processor  payments  1          14817           18402         3585     consumer-2   /10.0.1.5      worker-2
# payments-processor  payments  2          15102           15102            0     consumer-3   /10.0.1.6      worker-3
That gives you one point in time. To watch lag, you either script the command on a cron, or you publish JMX metrics from the broker and consumer JVM and scrape them with Prometheus. Both work. Both are work you have to maintain.
What a healthy consumer lag looks like
There is no single threshold. Lag is meaningful relative to the consumer's throughput and the SLA you owe downstream.
- Frame lag as N seconds of traffic, not a raw message count. If your consumer processes 5,000 msg/s and you accept 30 s of latency, your alert threshold is 150,000 messages.
- Rate of change matters more than absolute level. A consumer doing 50k/s that suddenly drops to 0/s with lag climbing linearly is more urgent than a steady-state lag of 200k.
- Per-partition matters. Group-level lag can look fine while one partition is stuck because of a poison pill or a slow downstream call.
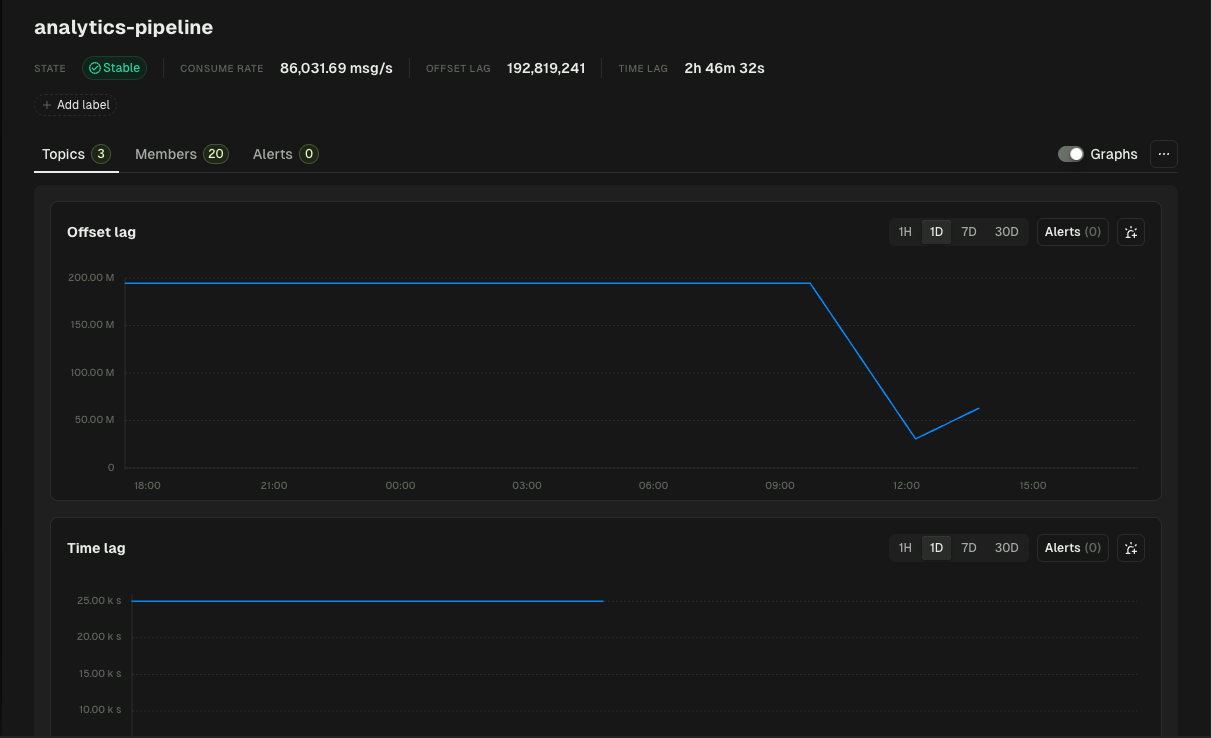
Monitoring consumer lag with Conduktor Console
Conduktor Console connects to your Kafka clusters and reads consumer lag through the same admin API that kafka-consumer-groups.sh uses — no agents on your brokers, no consumer-side instrumentation. What you get on top of the raw number:
- A live view of lag per group and per partition across every cluster you connect, with the lag trend over time rather than a single snapshot.
- Threshold-based alerts routed to Slack, Microsoft Teams, email, or a webhook (the webhook covers PagerDuty, Opsgenie, and anything else with an HTTP endpoint). Set a threshold on offset lag (messages) or on time lag (seconds). Teams own their own group alerts; the platform team owns cluster-level ones.
- Ownership context. Consumer groups registered through the application catalog can be mapped to the application and team that runs them, so the alert lands with the person who can fix it — not the platform on-call.
For the broader monitoring picture (broker health, partition replication, connector failures), see Kafka monitoring with Conduktor. For a step-by-step walkthrough of setting an alert, see the alerting documentation.
Conduktor vs Prometheus + Grafana for consumer lag
Both options work. The right choice depends on what you already run, how many teams own consumers, and how much glue code you want to maintain.
| Concern | Prometheus + Grafana | Conduktor Console |
|---|---|---|
| Setup | kafka_exporter (or similar) + Prometheus scrape config + Grafana dashboard. Add a JMX exporter on each consumer if you also want client-side records-lag | Connect cluster, lag is visible immediately |
| Lag granularity | Per-group, per-partition (with the right exporter) | Per-group, per-partition |
| Alerting | Prometheus AlertManager rules in PromQL | UI thresholds, per-group, owned by the team |
| Ownership / per-team alerts | DIY with labels and routing trees | First-class: groups mapped to applications and owners |
| Multi-cluster | Per-cluster scrape, federate or remote-write into Thanos / Cortex / a central Prometheus | Single dashboard across every connected cluster |
| Works alongside the other | — | Yes — Conduktor exposes its own metrics endpoint to Prometheus |
Common consumer lag problems and where to look
- Lag climbing on one partition. Check for a poison-pill message at the head of that partition, or for a key whose downstream call (DB write, HTTP request) is slow.
- Lag climbing across all partitions in a group. Throughput problem. Either the consumer is under-provisioned, the downstream is slow, or a single consumer instance is doing all the work because of an uneven partition assignment.
- Lag holding at zero with no recent LogEndOffset movement. The consumer looks caught up, but the topic may be idle and the consumer process may already be dead. Lag alone cannot distinguish the two — watch consumer group member count and time-since-last-commit alongside lag.
- Lag oscillating around a high value. The consumer is keeping up on average but is bursty. Usually a downstream call with variable latency. Not always urgent, but worth a graph.
For the concept-level primer, see the glossary entry on consumer lag monitoring. For a deeper take on choosing thresholds, see Kafka Consumer Lag Alerting Thresholds.
Frequently asked questions
What is Kafka consumer lag?
Consumer lag is the number of messages a consumer group still has to process on a partition. It equals the partition's log-end offset minus the group's last committed offset. Group-level lag is the sum across the partitions the group owns.
How do I check consumer lag from the command line?
Use kafka-consumer-groups.sh --bootstrap-server . The output includes CURRENT-OFFSET, LOG-END-OFFSET, and LAG per partition.
What's a normal consumer lag threshold?
There isn't a universal one. Express the threshold in seconds-of-traffic relative to your consumer's throughput rather than a raw message count, then alert when lag exceeds the latency budget you owe downstream.
How does Conduktor monitor consumer lag?
Conduktor Console reads lag through the Kafka admin API the same way the CLI does, then renders it per group and per partition across every connected cluster. You set thresholds per group on either offset lag or time lag, and route alerts to Slack, Teams, email, or any webhook endpoint (which covers PagerDuty, Opsgenie, and similar).
Do I need to install agents on my brokers or consumers?
No. Conduktor connects to the cluster as a Kafka client and uses the standard admin API. There is nothing to install on the brokers or the consumer applications.
Can Conduktor work alongside Prometheus and Grafana?
Yes. Conduktor exposes its own metrics endpoint that Prometheus can scrape. Teams who already have Grafana dashboards keep them; Conduktor adds the per-team ownership and self-service alerting that raw metrics dashboards don't provide.
I have more questions.
Drop us a line and we'll get back to you.
Monitor Consumer Lag in Minutes
Connect your cluster and see lag per group, per partition, across every environment. Alerts routed to the team that owns the consumer, not the platform on-call.