Kafka Storage Internals: Segments, Indexing, and Why Retention Time Lies
Deep dive into Kafka segments, indexing, and log retention policies—optimize storage, compaction, and broker performance for production clusters.

Apache Kafka is a commit-log system. Records append to the end of each partition, and each partition splits into segments. Segments enable deletion of older records through compaction and improve performance.

Kafka Relationships
Kafka exposes log-related configurations that control segment rolling and log retention. These configurations determine how long records persist and directly impact broker performance, especially when the cleanup policy is set to Delete.
Partition Structure on the File System
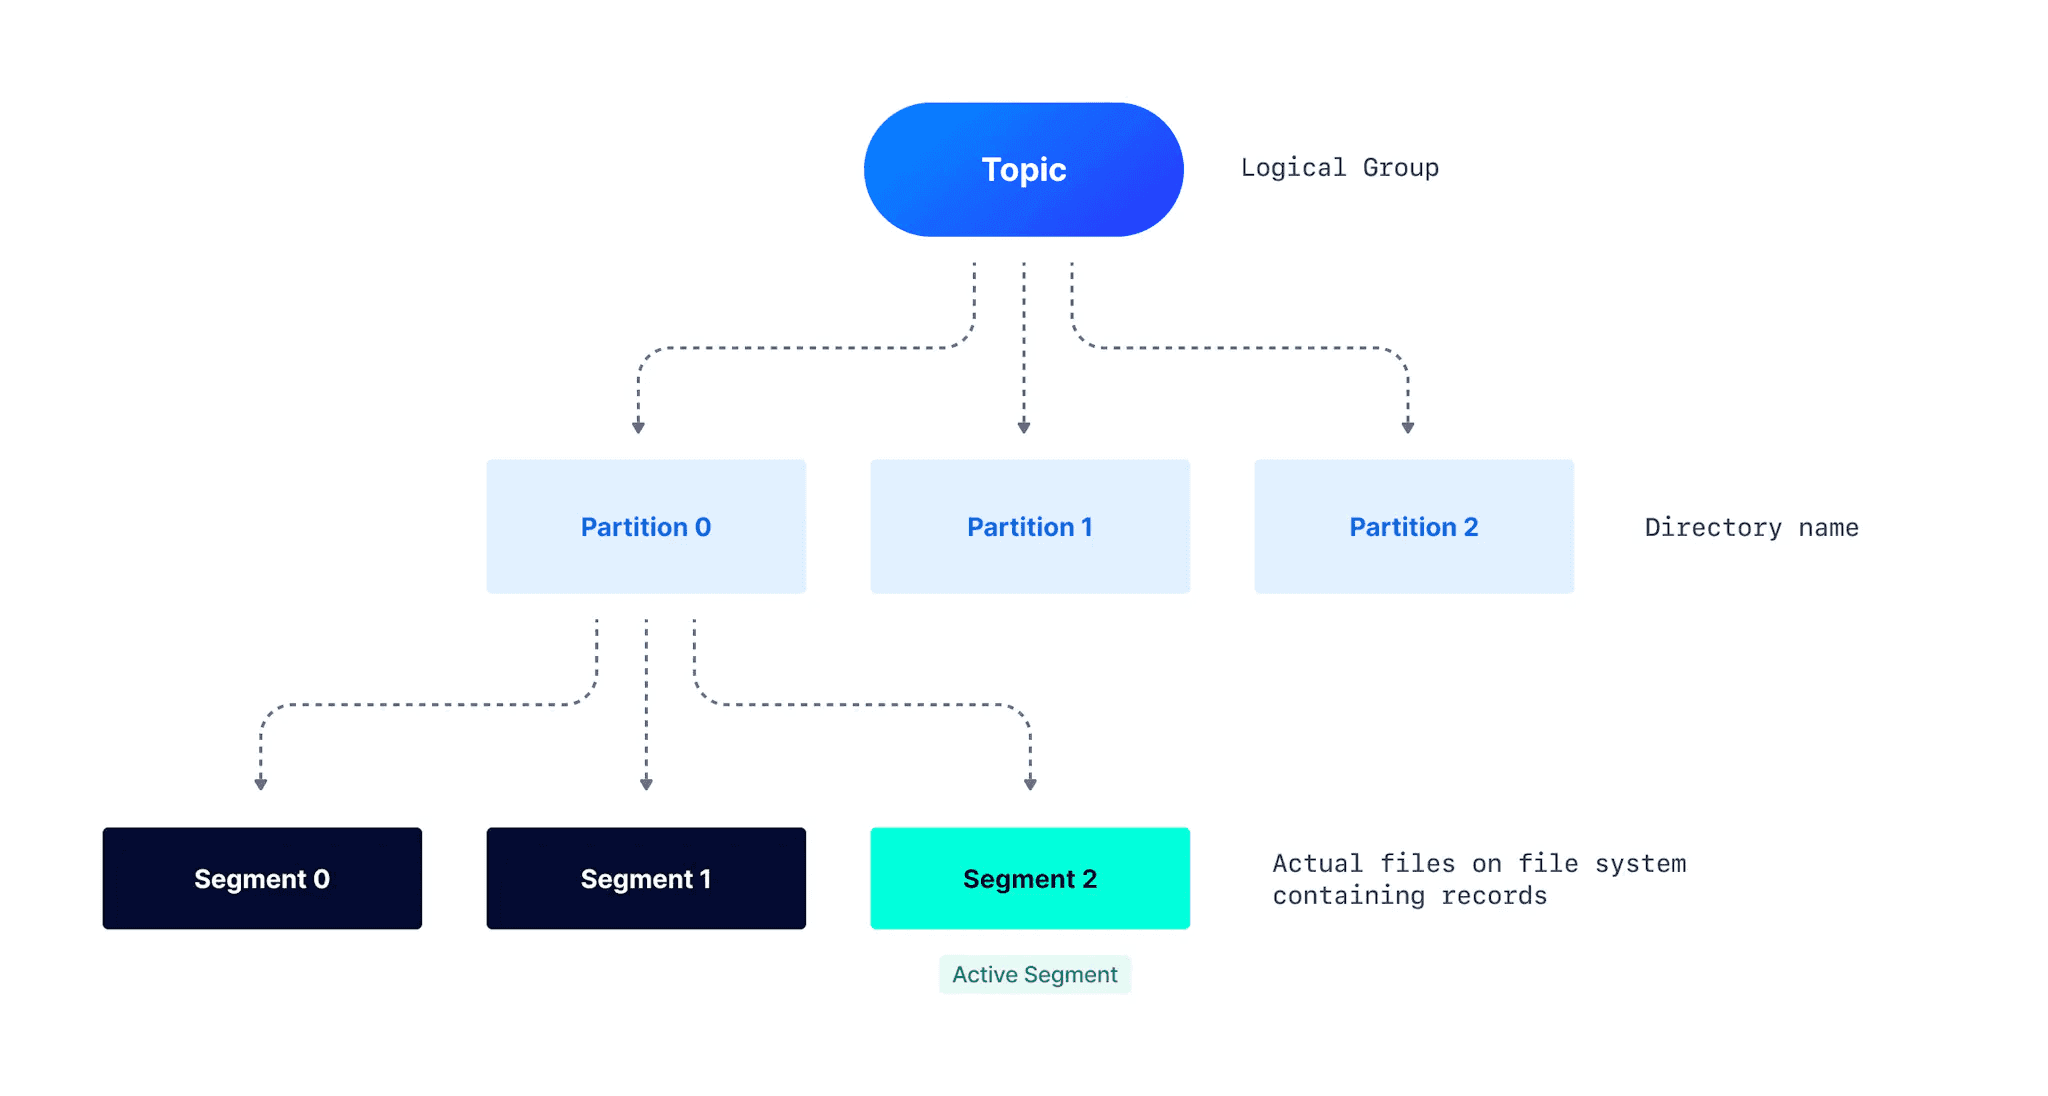
A Kafka topic divides into partitions. A partition is a logical unit where records append, but it is not the unit of storage. Partitions split into segments, which are the actual files on disk.
Multiple segments improve performance and maintainability. Consumers read from smaller segment files rather than one huge partition file. A directory with the partition name contains all segments for that partition.
Sample directory structure for topic my-topic and partition my-topic-0:
|── my-topic-0
 ├── 00000000000000000000.index
 ├── 00000000000000000000.log
 ├── 00000000000000000000.timeindex
 ├── 00000000000000001007.index
 ├── 00000000000000001007.log
 ├── 00000000000000001007.snapshot
 ├── 00000000000000001007.timeindex
├── leader-epoch-checkpoint- .log file: Contains the actual records up to a specific offset. The filename indicates the starting offset.
- .index file: Maps record offset to byte offset within the .log file. Used to read records from any specific offset.
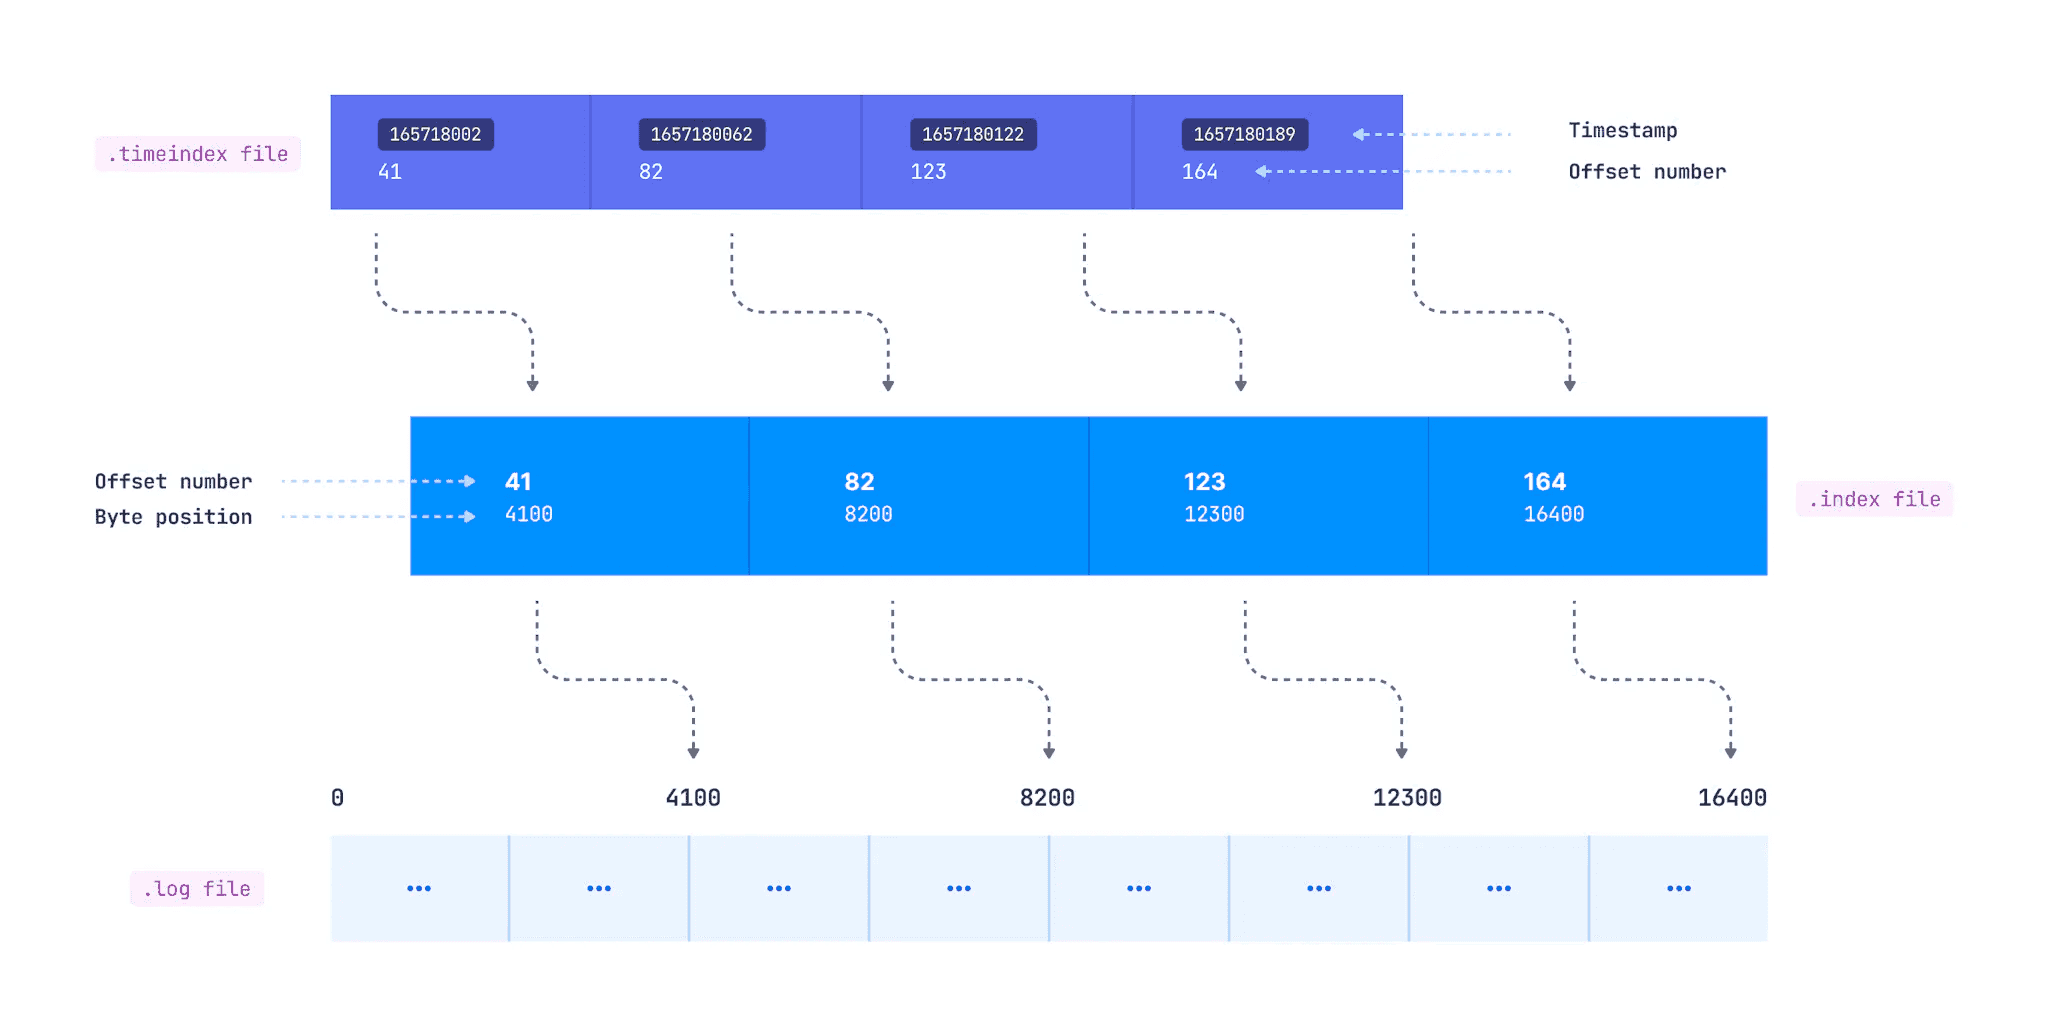
- .timeindex file: Maps timestamp to record offset, which then maps to byte offset via the .index file. Enables reading records from a specific timestamp.
- .snapshot file: Contains producer state regarding sequence IDs to prevent duplicate records. Used when a preferred leader returns after a new leader election to restore state. Only exists for the active segment.
- leader-epoch-checkpoint: Tracks the number of leaders previously assigned by the controller. Contains two columns: epochs and offsets. Each row checkpoints the latest recorded leader epoch and the leader's latest offset upon becoming leader.
From this structure, the first log segment 00000000000000000000.log contains records from offset 0 to offset 1006. The next segment 00000000000000001007.log starts from offset 1007 and is the active segment.

Active Segment
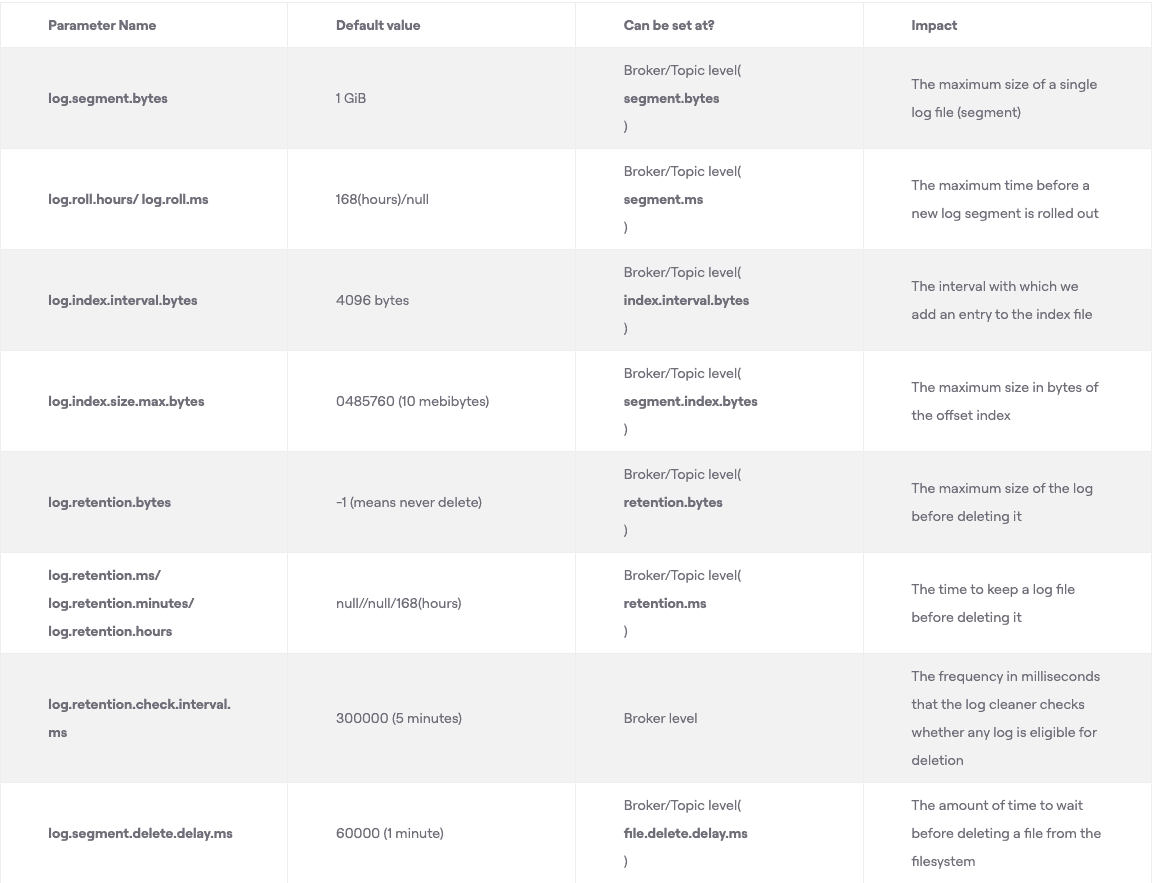
The active segment is the only file open for writing. Consumers can read from all segments, but only the active segment accepts new records. When the active segment reaches the configured size (log.segment.bytes, default 1 GB) or age (log.roll.hours or log.roll.ms, default 7 days), it rolls. Rolling means the active segment closes as read-only and a new active segment opens for read-write.
How Kafka Indexes Enable Fast Offset Lookups
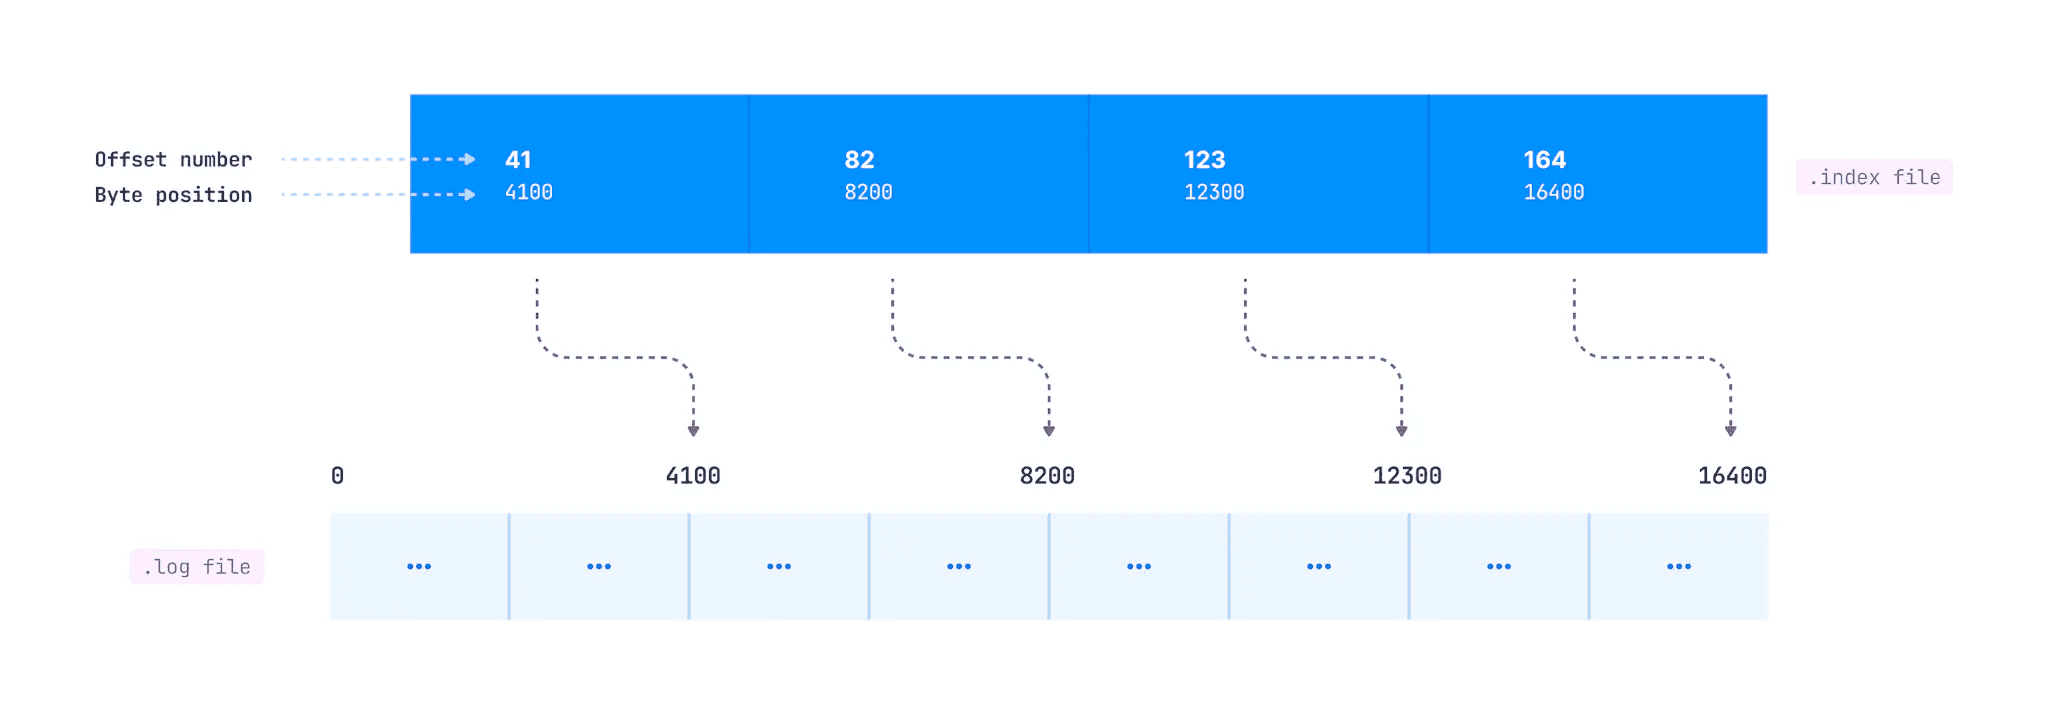
Indexing enables consumers to read from any specific offset or time range. The .index file maps logical offset to byte offset within the .log file. This mapping does not exist for every record.
The log.index.interval.bytes parameter (default 4096 bytes) controls index entry creation. After every 4096 bytes added to the log, an entry adds to the index. If producers send 100-byte records, a new index entry appears after every 41 records (41 * 100 = 4100 bytes).

New Index Appended
In this diagram, offset 41 sits at byte 4100 in the log file, offset 82 at byte 8200, and so on.
When a consumer requests a specific offset, Kafka searches as follows:
- Find the .index file whose name has a value less than the requested offset. For offset 1191, find the index file with the largest starting offset below 1191.
- Search the .index file for the entry where the requested offset falls.
- Use the mapped byte offset to access the .log file and start consuming from that position.
Consumers can also read from a specific timestamp using the .timeindex file. It maps timestamp to offset, which maps to the corresponding entry in the .index file, which maps to the actual byte offset in the .log file.

timeindex file
When Segments Roll: Three Conditions
The active segment rolls when any of these conditions occur:
- Maximum segment size:
log.segment.bytes, defaults to 1 GB - Maximum segment age:
log.roll.msandlog.roll.hours, defaults to 7 days - Index or timeindex full:
log.index.size.max.bytes, defaults to 10 MB
The third condition is often overlooked. With log.index.interval.bytes at 4096 bytes, a 1 GB segment creates 1 GB / 4096 bytes = 262,144 index entries. Each entry takes 8 bytes, totaling 2 MB of index (262,144 * 8 bytes). The default 10 MB index handles segments up to 5 GB.
If you increase segment size above 5 GB, you must increase index file size too. If you reduce index file size, you may need to reduce segment size accordingly.
The timeindex needs attention too. Each timeindex entry is 1.5x larger than an index entry (12 bytes vs 8 bytes), so it fills faster and can trigger segment rolling. For a 1 GB segment, the timeindex takes 262,144 * 12 = 3 MB.
When to Change Segment Size
Generally, keep log.segment.bytes at default. Here's what happens when you change it:
Decrease for better compaction: If your cleanup policy is compact and data arrives slowly, compaction may lag because it only occurs when segments close. If producers send little data and segments don't fill, decreasing log.segment.bytes makes compaction more effective.
Increase for high partition counts: Producers append to active segments while consumers read from any segment. A broker hosting many partitions opens many files simultaneously.
The maximum open files (nofile) limit defaults to 1024 on some Linux versions. The "Too many open files" error during Kafka operation stems from this limit. Kafka recommends setting nofile to 100,000. If you host many partitions on a single broker, increasing log.segment.bytes (within system RAM limits) reduces segment count and therefore open file count.
Why Records Persist Longer Than Retention Time
Kafka retains logs longer than traditional message queues that delete after consumption. Multiple consumers can read the same data, and data can flow to warehouses for analytics.
Configure retention by bytes with log.retention.bytes, or by time with log.retention.ms, log.retention.minutes, or log.retention.hours (7 days default).
Consider a topic with 600,000 ms (10 min) retention and 16,384 byte segment size. You expect segments to roll at 16 KB and records to delete after 10 minutes. Neither expectation holds exactly.
A segment and its records can only delete when closed. Several factors delay actual deletion:
Slow producers extend retention: If 16 KB doesn't fill within 10 minutes, older records persist. Actual retention exceeds 10 minutes.
Fast producers also extend retention: A quickly-filled segment closes but only deletes when its last record reaches 10 minutes old. If a segment fills in 7 minutes and closes, the last record stays 10 more minutes. The first record in that segment persists for 17 minutes.
The cleanup thread adds delay: The thread checking which segments need deletion runs every 5 minutes (log.retention.check.interval.ms). Depending on timing, the 10-minute deadline can slip. Our 17-minute example could become 22 minutes.
Deletion delay adds more time: log.segment.delete.delay.ms (default 1 minute) defines when a file marked "deleted" actually removes from disk. Our example extends to 23 minutes, more than double the configured 10 minutes.
The log.retention.ms parameter defines a minimum retention time, not an exact one.
Consumers read from closed segments but not from deleted ones, even if those deleted segments still exist on disk awaiting physical removal.
Note: This explanation uses single records for clarity. In practice, record batches append to segment files.
Configuration Reference

