Data Freshness Monitoring: SLA Management
Ensuring that data arrives on time is just as important as ensuring it arrives correctly. Data freshness monitoring and SLA management are core practices for maintaining reliable data pipelines and meeting business expectations. This article covers how to implement freshness monitoring, define meaningful SLAs, and respond when data misses timeliness requirements.
Freshness is one of the five pillars of data observability, alongside data quality, volume, schema, and lineage. For a comprehensive overview, see What is Data Observability: The Five Pillars. To understand how freshness relates to other quality dimensions, refer to Data Quality vs Data Observability: Key Differences. 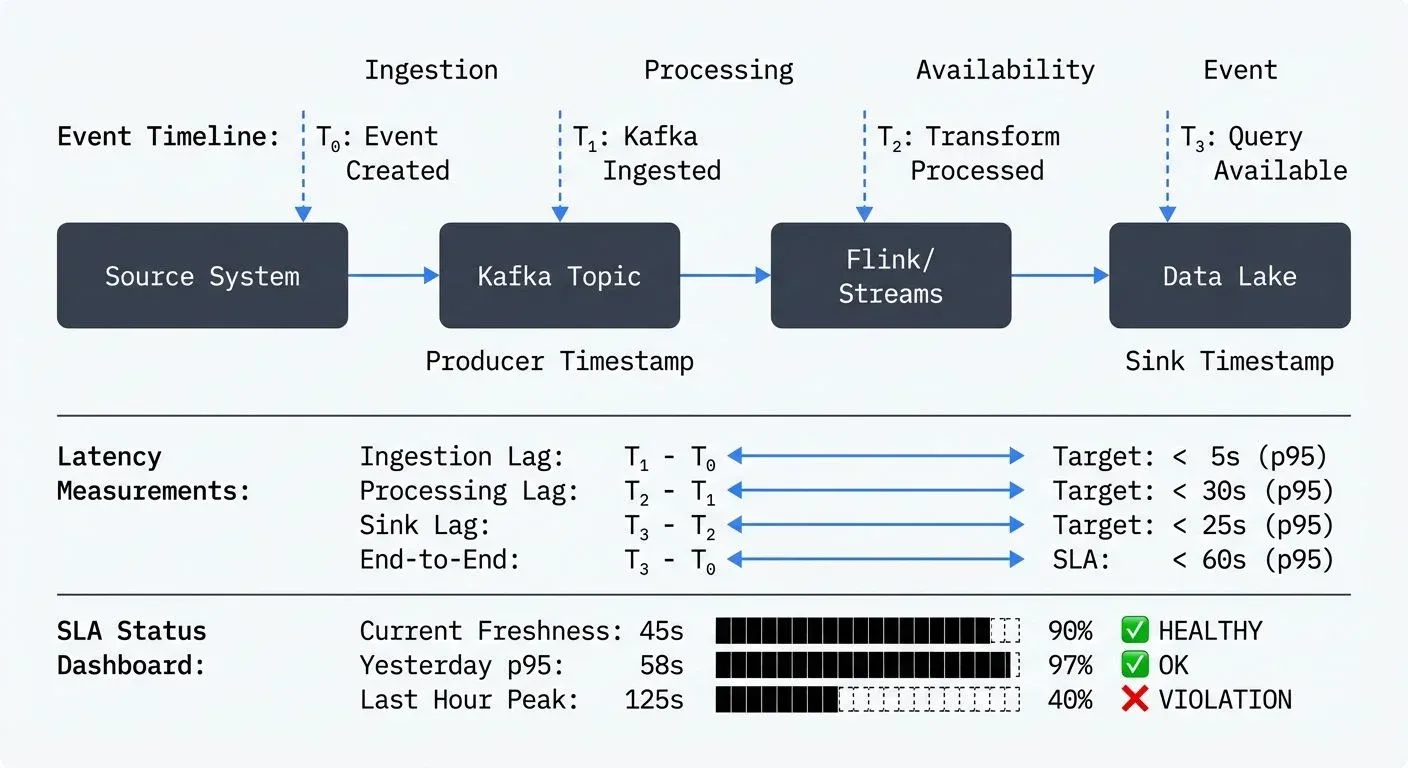
Understanding Data Freshness
Data freshness refers to how current or up-to-date your data is relative to when it was generated or should be available for consumption. While data quality focuses on correctness, freshness focuses on timeliness. A dataset might be perfectly accurate but completely useless if it arrives hours late for a time-sensitive business decision.
Freshness manifests differently across pipeline architectures:
- Batch pipelines typically measure freshness as the time between scheduled runs and actual completion. If your daily ETL job should complete by 6 AM but finishes at 9 AM, you have a three-hour freshness violation.
- Streaming pipelines measure freshness as the end-to-end latency from event generation to availability in the target system. For a Kafka-based pipeline, this includes time spent in topics, processing delays, and sink write latency.
- Hybrid systems combine both paradigms, often ingesting streaming data but aggregating it in batch windows, creating complex freshness requirements at multiple stages.
Defining Meaningful SLAs
Service Level Agreements for data freshness should be derived from business requirements, not arbitrary technical targets. The process begins with understanding how data is consumed:
- Business-driven SLAs emerge from asking the right questions. Does the marketing team need customer behavior data within 15 minutes to trigger personalized campaigns? Does the finance dashboard require yesterday's transactions by 8 AM? These business needs translate directly into technical SLAs.
- Tiered SLAs recognize that not all data has the same urgency. Critical real-time fraud detection might require sub-second freshness with 99.9% reliability, while monthly reporting aggregates might tolerate day-old data with 95% reliability. This tiering allows you to allocate engineering resources where they matter most.
- Composite SLAs acknowledge that modern pipelines have multiple stages. For a streaming pipeline ingesting from Kafka, processing with Apache Flink 1.19+, and landing in a data warehouse, you might define:
- Kafka ingestion lag: < 5 seconds (p95 - 95th percentile, meaning 95% of events meet this target)
- Processing latency: < 30 seconds (p95)
- End-to-end freshness: < 60 seconds (p95)
The percentile notation (p95, p99) indicates that the specified percentage of requests must meet the target. p95 means 95 out of 100 events arrive within the threshold, while allowing 5% outliers. This is more realistic than requiring 100% compliance, which would force you to design for worst-case scenarios. Using p99 (99th percentile) is stricter, only 1% of events can exceed the threshold, appropriate for critical use cases like fraud detection.
Each component contributes to the overall SLA, and monitoring each stage helps isolate issues quickly.
Implementing Freshness Monitoring
Effective freshness monitoring requires instrumentation at multiple levels:
Event Timestamp Tracking
The foundation is capturing accurate timestamps throughout the pipeline. Every event should carry:
- Event time: when the event actually occurred (source system timestamp)
- Ingestion time: when it entered your system (Kafka producer timestamp)
- Processing time: when it was transformed (Flink/Streams processing timestamp)
- Availability time: when it became queryable (sink write timestamp)
With these timestamps, you can calculate critical metrics like event-time lag (processing time minus event time) and end-to-end latency (availability time minus event time).
Example: Enriching Events with Pipeline Timestamps
Here's a practical example using Kafka Streams to track freshness through the pipeline:
// Kafka Streams topology that enriches events with pipeline timestamps
StreamsBuilder builder = new StreamsBuilder();

KStream<String, OrderEvent> orders = builder.stream("orders",
    Consumed.with(Serdes.String(), orderEventSerde));

KStream<String, EnrichedOrder> enrichedOrders = orders
    .mapValues((readOnlyKey, order) -> {
        EnrichedOrder enriched = new EnrichedOrder(order);

        // Event time: from source system (already in order object)
        enriched.setEventTime(order.getCreatedAt());

        // Ingestion time: Kafka record timestamp
        enriched.setIngestionTime(context().timestamp());

        // Processing time: current system time
        enriched.setProcessingTime(System.currentTimeMillis());

        // Calculate freshness metrics
        long ingestionLag = enriched.getIngestionTime() - enriched.getEventTime();
        long processingLag = enriched.getProcessingTime() - enriched.getEventTime();

        enriched.setIngestionLagMs(ingestionLag);
        enriched.setProcessingLagMs(processingLag);

        return enriched;
    });

// Write to sink with availability time added by the connector
enrichedOrders.to("enriched-orders", Produced.with(Serdes.String(), enrichedOrderSerde));
In the downstream sink (e.g., Snowflake, BigQuery), add a final timestamp when data becomes queryable:
-- Snowflake table with freshness tracking
CREATE TABLE enriched_orders (
    order_id STRING,
    event_time TIMESTAMP_NTZ,        -- From source system
    ingestion_time TIMESTAMP_NTZ,    -- When entered Kafka
    processing_time TIMESTAMP_NTZ,   -- When processed by Streams
    availability_time TIMESTAMP_NTZ, -- When loaded to warehouse
    event_to_available_latency_ms NUMBER AS (
        DATEDIFF('millisecond', event_time, availability_time)
    )
);

-- Query to monitor current freshness SLA compliance
SELECT
    DATE_TRUNC('hour', availability_time) AS HOUR,
    PERCENTILE_CONT(0.95) WITHIN GROUP (ORDER BY event_to_available_latency_ms) AS p95_latency_ms,
    PERCENTILE_CONT(0.99) WITHIN GROUP (ORDER BY event_to_available_latency_ms) AS p99_latency_ms,
    COUNT(*) AS record_count
FROM enriched_orders
WHERE availability_time >= DATEADD('day', -1, CURRENT_TIMESTAMP())
GROUP BY 1
ORDER BY 1 DESC;
This approach provides granular visibility into where latency accumulates, enabling targeted optimization.
Streaming Integration Monitoring
For Kafka-based architectures, consumer lag is your primary freshness indicator, it measures how far behind consumers are from the latest messages in a topic. Modern monitoring tools provide real-time visibility into consumer group lag across all topics and partitions. When lag increases, it signals that consumers can't keep pace with producers, directly impacting data freshness.
Modern Kafka Monitoring Tools (2025)
Several specialized tools have emerged for Kafka lag monitoring:
Kafka Lag Exporter (open-source) exports consumer group lag metrics to Prometheus, enabling sophisticated alerting and visualization in Grafana. It works with Kafka 2.0+ and supports the modern KRaft mode introduced in Kafka 4.0:
# Deploy Kafka Lag Exporter with Helm
helm repo add kafka-lag-exporter https://seglo.github.io/kafka-lag-exporter/
helm install kafka-lag-exporter kafka-lag-exporter/kafka-lag-exporter \
  --set clusters[0].name=production \
--set clusters[0].bootstrapBrokers=kafka:9092- Burrow (LinkedIn's open-source tool) provides HTTP endpoints for lag monitoring and automatically evaluates consumer health status, distinguishing between "stuck" consumers and those simply processing a backlog.
- Conduktor offers built-in lag monitoring dashboards with automatic alerting, ideal for teams managing Kafka clusters. The Consumer Lag metric tracks both record count and time lag (how old the oldest unconsumed message is). Learn more about monitoring brokers and apps in Conduktor.
- Enterprise Observability Platforms like Datadog Data Streams Monitoring and New Relic provide comprehensive pipeline visibility, combining Kafka lag with infrastructure metrics to correlate performance issues.
Streaming monitoring capabilities should extend beyond basic lag metrics to provide:
- Historical lag trends to identify degradation patterns
- Per-partition lag breakdown to detect imbalanced consumption
- Consumer group health metrics to catch failed instances
- Alert thresholds that trigger before SLA violations occur
- Time-based lag (not just record count) to measure actual freshness impact
This level of visibility is crucial for streaming pipelines where even brief lag spikes can cascade into SLA failures. For detailed coverage of consumer groups and lag mechanics, see Kafka Consumer Groups Explained.
Heartbeat and Canary Metrics
Passive monitoring detects problems after they occur. Active monitoring catches issues proactively:
Heartbeat records are synthetic events injected at regular intervals with known timestamps. By tracking when these records appear downstream, you measure actual pipeline latency without waiting for real data. If heartbeats stop appearing or show increasing delays, you know freshness is degrading.
Here's a simple heartbeat implementation using a scheduled producer:
from kafka import KafkaProducer
import json
import time
from datetime import datetime
from apscheduler.schedulers.blocking import BlockingScheduler

producer = KafkaProducer(
    bootstrap_servers=['localhost:9092'],
    value_serializer=lambda v: json.dumps(v).encode('utf-8')
)

def send_heartbeat():
    """Send a heartbeat event every minute"""
    heartbeat = {
        'type': 'heartbeat',
        'source': 'freshness-monitor',
        'timestamp': datetime.utcnow().isoformat(),
        'timestamp_ms': int(time.time() * 1000)
    }
    producer.send('pipeline-heartbeats', value=heartbeat)
    producer.flush()
    print(f"Heartbeat sent at {heartbeat['timestamp']}")

# Schedule heartbeat every minute
scheduler = BlockingScheduler()
scheduler.add_job(send_heartbeat, 'interval', minutes=1)
scheduler.start()
Downstream, monitor when heartbeats arrive to detect pipeline degradation before it affects real data.
Canary pipelines run simplified versions of production workloads continuously, providing constant freshness signals even during low-traffic periods when real events are sparse.
Data Quality Framework Integration
Modern data quality frameworks include freshness testing as a first-class feature. These tools integrate naturally into your CI/CD and data pipelines:
dbt Freshness Tests (dbt 1.0+) define acceptable data age directly in your source configurations:
# models/sources.yml
version: 2

sources:
  - name: production_db
    database: postgres
    freshness:
      warn_after: {count: 12, period: hour}
      error_after: {count: 24, period: hour}
    loaded_at_field: updated_at

    tables:
      - name: orders
        freshness:
          warn_after: {count: 1, period: hour}
          error_after: {count: 2, period: hour}

      - name: customers
        # Uses source-level freshness defaults
Run freshness checks as part of your dbt pipeline:
# Check freshness for all sources
dbt source freshness

# Fail the pipeline if any source fails error threshold
dbt source freshness --select source:production_db
For more on dbt testing practices, see dbt Tests and Data Quality Checks.
Great Expectations 1.0+ provides sophisticated freshness expectations with custom thresholds:
import great_expectations as gx
from datetime import datetime, timedelta

context = gx.get_context()

# Define freshness expectation
validator = context.sources.pandas_default.read_dataframe(df)

validator.expect_column_max_to_be_between(
    column="event_timestamp",
    min_value=datetime.utcnow() - timedelta(hours=2),
    max_value=datetime.utcnow(),
    meta={
        "notes": "Data must be no older than 2 hours for real-time dashboard SLA"
    }
)

# Run validation in your pipeline
checkpoint = context.add_or_update_checkpoint(
    name="freshness_check",
    validations=[
        {
            "batch_request": batch_request,
            "expectation_suite_name": "orders_freshness_suite",
        }
    ],
)

result = checkpoint.run()
if not result.success:
    # Trigger alert or fail pipeline
    raise ValueError(f"Freshness SLA violated: {result}")
Soda Core 3.0+ (open-source alternative to Soda Cloud) uses simple YAML checks:
# checks/orders_freshness.yml
checks for orders:
  - freshness(event_timestamp) < 1h:
      name: Orders must be fresh within 1 hour
      warn:
        when required
  - freshness(event_timestamp) < 2h:
      name: Orders must be fresh within 2 hours
      fail:
        when required

# Check with custom SQL
  - freshness using max(event_timestamp):
      warn: when > 1h
      fail: when > 2h
Run Soda checks in your pipeline:
soda scan -d production -c configuration.yml checks/orders_freshness.ymlMonte Carlo and other enterprise data observability platforms provide automated freshness anomaly detection using machine learning. They learn your typical data arrival patterns and alert when deviations occur, reducing manual threshold tuning. For more on data quality frameworks, see Data Quality Dimensions: Accuracy, Completeness, and Consistency.
Responding to Freshness Violations
Monitoring without action is just observation. When freshness SLAs are breached, your response should be systematic. For detailed incident response procedures, see Data Incident Management and Root Cause Analysis.
Automated Alerting
Configure multi-level alerts:
- Warning thresholds at 70-80% of SLA targets give teams time to investigate before violations
- Critical alerts at SLA boundaries trigger immediate response
- Severity escalation routes persistent violations to on-call engineers
Context-rich alerts include not just the metric value but also recent trends, affected data domains, and potential impact on downstream consumers.
Root Cause Analysis
Freshness violations typically stem from:
- Volume spikes: sudden increases in data volume overwhelming processing capacity
- Resource constraints: CPU, memory, or I/O saturation in compute or storage layers
- Dependency failures: upstream system delays or outages
- Configuration issues: inefficient processing logic or suboptimal parallelism
Effective monitoring isolates which component is responsible. If Kafka consumer lag is stable but warehouse availability is delayed, the issue is in the sink, not ingestion or processing.
Mitigation Strategies
Short-term mitigations include:
- Scaling compute resources to process backlog faster
- Temporarily increasing parallelism or partition count
- Pausing non-critical workloads to free resources
- Implementing backpressure to prevent cascade failures (see Backpressure Handling in Streaming Systems)
Long-term improvements address systemic issues:
- Optimizing processing logic to reduce per-event latency
- Right-sizing infrastructure based on realistic capacity planning
- Implementing data tiering to separate critical from non-critical flows
- Adding circuit breakers and graceful degradation patterns
Building a Freshness-Aware Culture
Technical solutions alone don't ensure fresh data. Organizational practices matter:
- SLA documentation should be centralized, version-controlled, and accessible to both engineering and business stakeholders. When everyone understands the commitments, they can make informed decisions about dependencies. Consider incorporating freshness SLAs into your data contracts, explicit agreements between data producers and consumers. For detailed guidance, see Data Contracts for Reliable Pipelines.
- Regular SLA reviews adapt targets as business needs evolve. Quarterly reviews assess whether SLAs remain relevant and achievable.
- Freshness dashboards provide self-service visibility. Data consumers should see current freshness metrics for datasets they depend on, reducing surprise and enabling proactive mitigation. Integrating freshness metrics with data lineage tools provides end-to-end visibility into how delays propagate through dependent datasets. For more on tracking data flow, see Data Lineage Tracking: Data From Source to Consumption.
Conclusion
Data freshness monitoring and SLA management shift data engineering from reactive fire-fighting to proactive reliability. By defining business-driven SLAs, implementing monitoring across batch and streaming pipelines, and building systematic response processes, you ensure that data arrives when it's needed.
The investment pays off beyond meeting SLAs. It provides early warning of capacity issues, validates architectural decisions, and builds trust with data consumers. Fresh data isn't optional when real-time decisions drive business outcomes.
Start with your most critical pipelines, establish baseline SLAs, and expand coverage gradually. Tools like Kafka Lag Exporter, dbt freshness checks, Great Expectations, Soda Core, and platforms like Monte Carlo cover most of what you need. Good tooling and a team that understands freshness metrics will get you most of the way there.
Related Concepts
- Consumer Lag Monitoring - Detailed streaming lag tracking strategies
- Data Quality Dimensions: Accuracy, Completeness, and Consistency - Understanding timeliness in context
- What is Data Observability: The Five Pillars - Freshness as part of observability
Sources and References
- Google SRE Book - Service Level Objectives - Foundational guidance on defining and managing SLAs and SLOs
- Apache Flink Metrics and Monitoring - Tracking latency and processing time in stream processing (Flink 1.19+)
- Kafka Lag Exporter - Open-source Prometheus exporter for Kafka consumer lag metrics, supports KRaft mode
- Datadog Data Streams Monitoring - End-to-end latency tracking for Kafka pipelines (2025)
- dbt Source Freshness - Implementing freshness checks in analytics pipelines (dbt 1.0+)
- Great Expectations Freshness Expectations - Data validation framework with time-based expectations (GX 1.0+)
- Soda Core Data Quality Checks - Open-source data quality framework with freshness monitoring (Soda 3.0+)
- Burrow - Kafka Consumer Lag Monitoring - LinkedIn's consumer lag monitoring tool with health evaluation
- Conduktor Platform - Kafka management and monitoring platform with comprehensive lag and latency metrics