Capture OpenTelemetry Signals in Apache Kafka with Our New OTLP Source Connector
OpenTelemetry has become the dominant instrumentation standard. If you're building a new service today, you're almost certainly using OpenTelemetry SDKs. The APIs are stable, vendor support is universal, and the collector ecosystem covers most backends out of the box.
But most setups still look the same: traces go to Jaeger or Tempo, metrics go to Prometheus or Datadog, logs go to Elasticsearch or Loki. Each backend is a silo. You're locked into whatever analysis it provides.
We built a Kafka Connect source connector that changes this. It receives OTLP data (traces, metrics, logs) and writes it to Kafka topics. Your telemetry becomes just another stream: durable, replayable, and available to any consumer you want.
The observability pipeline problem
The standard setup works: applications send telemetry to backends, sometimes through an OpenTelemetry Collector that routes to multiple destinations. For dashboards and alerting, this is fine. Most teams don't need anything more.
The problems show up when you try to do something the backend wasn't designed for.
You can't replay historical data. Realize next week that you should have been tracking something differently? Those spans are trapped in a backend with limited query capabilities.
Custom analytics are painful. Training an ML model on trace data, or joining traces with business events, is hard or impossible when the data sits in Jaeger.
You're coupled to vendor capabilities. Each backend decides what queries you can run, how long data is retained, and what retention costs. Keeping telemetry for 90 days in a commercial backend gets expensive fast.
When telemetry data lives in Kafka topics, it becomes part of your event-driven architecture. You can replay it, process it with Kafka Streams, join it with other data, sink it to a data lake, and fan it out to multiple consumers, including traditional observability backends.
The connector
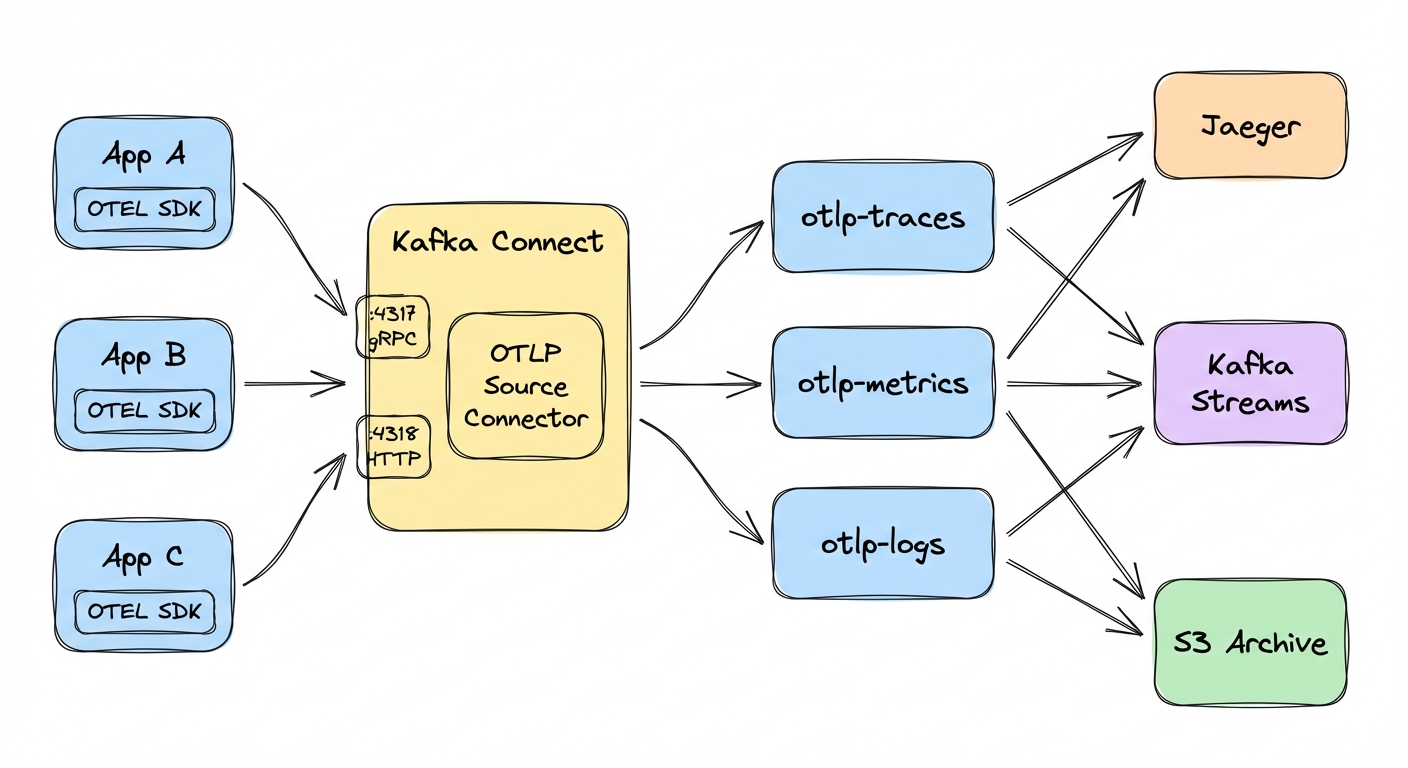
The Kafka Connect OpenTelemetry Source Connector exposes standard OTLP endpoints (gRPC on port 4317 and HTTP on port 4318), receives traces, metrics, and logs, and writes them to Kafka topics.
It listens on both gRPC and HTTP simultaneously, so applications can use whichever protocol they already have configured. Traces, metrics, and logs route to separate topics automatically; you just name the topics. Output is either JSON (readable, larger) or Protobuf (binary, 3-5x smaller). The connector also exposes JMX metrics for queue utilization, message counts, and drop rates.
The connector is open source under the Apache License 2.0 and maintained by Conduktor: github.com/conduktor/kafka-connect-opentelemetry.
The connector buffers received data in memory before writing to Kafka. If the connector restarts with messages in the buffer, those messages are lost. Monitor the queue utilization JMX metrics and size the buffer appropriately for your throughput.
Quick start
A Docker Compose stack ships with the repository. Clone, build, and run:
git clone https://github.com/conduktor/kafka-connect-opentelemetry.git
cd kafka-connect-opentelemetry
mvn clean package -DskipTests
No local Java? Use Docker instead:
docker run --rm -v "$(pwd)":/app -w /app maven:3.9-eclipse-temurin-17 mvn clean package -DskipTestsStart the stack:
cd examples
docker compose up -d
This starts Kafka, Kafka Connect, a telemetry generator (telemetrygen), and Conduktor Console. The stack includes a connector-deploy container that automatically creates the connector once Kafka Connect is healthy — no manual deployment needed.
Here is the connector configuration the stack deploys for reference:
{
  "name": "otlp-source",
  "config": {
    "connector.class": "io.conduktor.connect.otel.OpenTelemetrySourceConnector",
    "tasks.max": "1",
    "kafka.topic.traces": "otlp-traces",
    "kafka.topic.metrics": "otlp-metrics",
    "kafka.topic.logs": "otlp-logs",
    "otlp.message.format": "json"
  }
}
Wait 30-60 seconds for services to be healthy, then verify the connector is running:
curl http://localhost:8083/connectors/otlp-source/status | jqYou should see "state": "RUNNING" for both the connector and its task. Now watch traces flow into Kafka:
docker exec kafka-otel /opt/kafka/bin/kafka-console-consumer.sh \
  --bootstrap-server localhost:9092 \
  --topic otlp-traces \
  --from-beginning \
  --max-messages 5
You'll see JSON traces from the telemetrygen container. Note that the output uses Protobuf JSON mapping, so field names are snake_case (resource_spans, scope_spans, start_time_unix_nano) even though the OTLP HTTP API accepts camelCase (resourceSpans, scopeSpans). Both forms are valid in Protobuf's JSON serialization; the connector produces the canonical snake_case form.
Open http://localhost:8080 to browse the same data in Conduktor Console.
Testing with different clients
OTLP is a standard protocol, so any OpenTelemetry SDK can send data to the connector. A few ways to test it:
Send traces with curl
The HTTP endpoint accepts JSON payloads. A minimal trace looks like this:
curl -X POST http://localhost:4318/v1/traces \
  -H "Content-Type: application/json" \
  -d '{
    "resourceSpans": [{
      "resource": {
        "attributes": [{
          "key": "service.name",
          "value": {"stringValue": "my-test-service"}
        }]
      },
      "scopeSpans": [{
        "spans": [{
          "traceId": "5b8efff798038103d269b633813fc60c",
          "spanId": "eee19b7ec3c1b174",
          "name": "test-operation",
          "kind": 1,
          "startTimeUnixNano": "1609459200000000000",
          "endTimeUnixNano": "1609459200500000000"
        }]
      }]
    }]
  }'
This sends a single span representing a 500ms operation. Check the otlp-traces topic to confirm it arrived.
Configure your applications
For real applications, point the SDK exporter at the connector with environment variables:
export OTEL_EXPORTER_OTLP_ENDPOINT=http://kafka-connect-host:4318
export OTEL_EXPORTER_OTLP_PROTOCOL=http/protobuf
export OTEL_SERVICE_NAME=my-application
Or configure the SDK programmatically (Python example):
from opentelemetry import trace
from opentelemetry.exporter.otlp.proto.http.trace_exporter import OTLPSpanExporter
from opentelemetry.sdk.trace import TracerProvider
from opentelemetry.sdk.trace.export import BatchSpanProcessor

# SDK appends /v1/traces automatically -- do not include it in the endpoint
otlp_exporter = OTLPSpanExporter(
    endpoint="http://kafka-connect-host:4318"
)

trace.set_tracer_provider(TracerProvider())
trace.get_tracer_provider().add_span_processor(
    BatchSpanProcessor(otlp_exporter)
)

# Your traces now go to Kafka
tracer = trace.get_tracer(__name__)
with tracer.start_as_current_span("my-operation"):
    # Your code here
    pass
The same pattern works for Java, Go, Node.js, .NET, and every other language with an OpenTelemetry SDK.
Configuration
The minimal setup is two lines:
{
  "connector.class": "io.conduktor.connect.otel.OpenTelemetrySourceConnector",
  "tasks.max": "1"
}
Everything else has sensible defaults: gRPC on 4317, HTTP on 4318, topics named otlp-traces, otlp-metrics, and otlp-logs, JSON format, and a 10,000-message queue.
Set tasks.max to 1. The connector binds to network ports (4317, 4318), so only one task can run per worker. To scale, deploy multiple connector instances on different ports behind a load balancer.
Key configuration options
| Parameter | Default | Description | Production recommendation |
|---|---|---|---|
otlp.grpc.enabled | true | Enable OTLP gRPC (port 4317) | Keep enabled |
otlp.http.enabled | true | Enable OTLP HTTP (port 4318) | Keep enabled |
kafka.topic.traces | otlp-traces | Topic for trace data | Use environment prefix: prod-traces |
kafka.topic.metrics | otlp-metrics | Topic for metric data | Use environment prefix: prod-metrics |
kafka.topic.logs | otlp-logs | Topic for log data | Use environment prefix: prod-logs |
otlp.message.format | json | Output format: json or protobuf | Use protobuf for high volume |
otlp.message.queue.size | 10000 | Buffer size per signal type | Increase to 20000-50000 for production |
Format selection: JSON vs Protobuf
| Format | Size | Readability | Performance | Best for |
|---|---|---|---|---|
| JSON | 3-5x larger | Human-readable | Slower | Development, debugging, compliance |
| Protobuf | Compact binary | Base64-encoded | Faster | Production, high volume |
Production configuration example
{
  "name": "otlp-production",
  "config": {
    "connector.class": "io.conduktor.connect.otel.OpenTelemetrySourceConnector",
    "tasks.max": "1",
    "kafka.topic.traces": "prod-traces",
    "kafka.topic.metrics": "prod-metrics",
    "kafka.topic.logs": "prod-logs",
    "otlp.message.format": "protobuf",
    "otlp.message.queue.size": "50000"
  }
}
Use cases
Some patterns that make sense once telemetry sits in Kafka:
Observability data lake
Write all telemetry to Kafka with 30-90 day retention, then sink to S3 or GCS for long-term compliance. Recent data lives in Kafka; historical data lives in cheap object storage. The cost difference compared to commercial backends is significant: S3 storage runs around $0.023/GB/month versus the per-GB ingestion fees most observability vendors charge.
ML on traces
Stream traces to Kafka, extract features (latency distributions, error rates, dependency graphs) with Kafka Streams, and feed the results to ML models for anomaly detection. Static thresholds miss the kind of drift these models can catch.
Fan-out
One connector ingests telemetry; multiple independent consumers process it. One sends to Jaeger, another to Prometheus, another archives to S3, another feeds a real-time dashboard. Each consumer works at its own pace.
Analytics and joins
Join traces with business events in Kafka Streams. For example: join checkout traces with order events to measure "time from checkout start to order confirmed." Or join error logs with deployment events to identify which deploy introduced a bug.
Decoupling apps from backends
Applications point at the connector. Swap observability backends without redeploying a single app; just change the Kafka consumer. Run multiple backends in parallel during a migration.
Cost optimization
Keep 100% of telemetry in Kafka (cheap storage), then sample or filter before forwarding to expensive backends. Send 10% to Datadog, archive the rest to S3. You preserve the raw data for deep dives without paying full ingestion costs.
Architecture patterns
Direct ingestion
Apps -> Connector -> Kafka -> Consumers
The simplest layout. Applications send OTLP to the connector, Kafka becomes primary observability storage. Good when you're building a custom observability platform.
Hybrid pipeline
Apps -> Connector -> Kafka -> OTEL Collector -> Backends
The connector writes to Kafka; an OTEL Collector consumes from Kafka and exports to traditional backends. You get Kafka's durable buffering and fan-out while keeping existing tools.
Multi-environment
Apps -> Connector(s) -> Kafka (prefixed topics)
Separate connector instances for prod/staging/dev, each with different ports and topic prefixes. Same Kafka cluster, isolated data.
Pre-processing
Apps -> Connector -> Kafka -> Kafka Streams -> Kafka -> Consumers
Ingest everything to raw topics. A Kafka Streams application filters, enriches, or aggregates before the data reaches expensive sinks.
Getting started
- Docker example (~5 minutes): github.com/conduktor/kafka-connect-opentelemetry
- Documentation: conduktor.github.io/kafka-connect-opentelemetry
- Build from source:
git clone https://github.com/conduktor/kafka-connect-opentelemetry.git
cd kafka-connect-opentelemetry
mvn clean package
Copy target/kafka-connect-opentelemetry-1.0.0-jar-with-dependencies.jar to your Kafka Connect plugins directory.
- Community: Conduktor Slack or GitHub Issues
OpenTelemetry standardized instrumentation. Where that data goes afterward is still up for grabs. For many teams, the answer is a single backend. That works. But if you need replay, custom analytics, compliance archives, or cost control at scale, Kafka is a better foundation.
The connector is open source, the configuration is minimal, and the Docker example runs in under five minutes. Give it a try.