Whitepaper
The Kafka Debugging Playbook: Six Phases from Alert to Root Cause
A Kafka troubleshooting and debugging framework for developers, SREs, and DevOps teams. Three production incidents walked through from alert to root cause, covering consumer lag, Kafka Connect, Schema Registry, offset resets, and reducing MTTR.
The setup
A JDBC source connector reads new rows from a PostgreSQL orders table and produces Avro-encoded messages to an 8-partition Kafka topic. Downstream, three consumer instances in the order-processing-v2 group process each order: payment API calls, inventory updates, then commit. Auto-commit is off. The consumer commits offsets after successful processing, which is standard for anything doing real work per message.
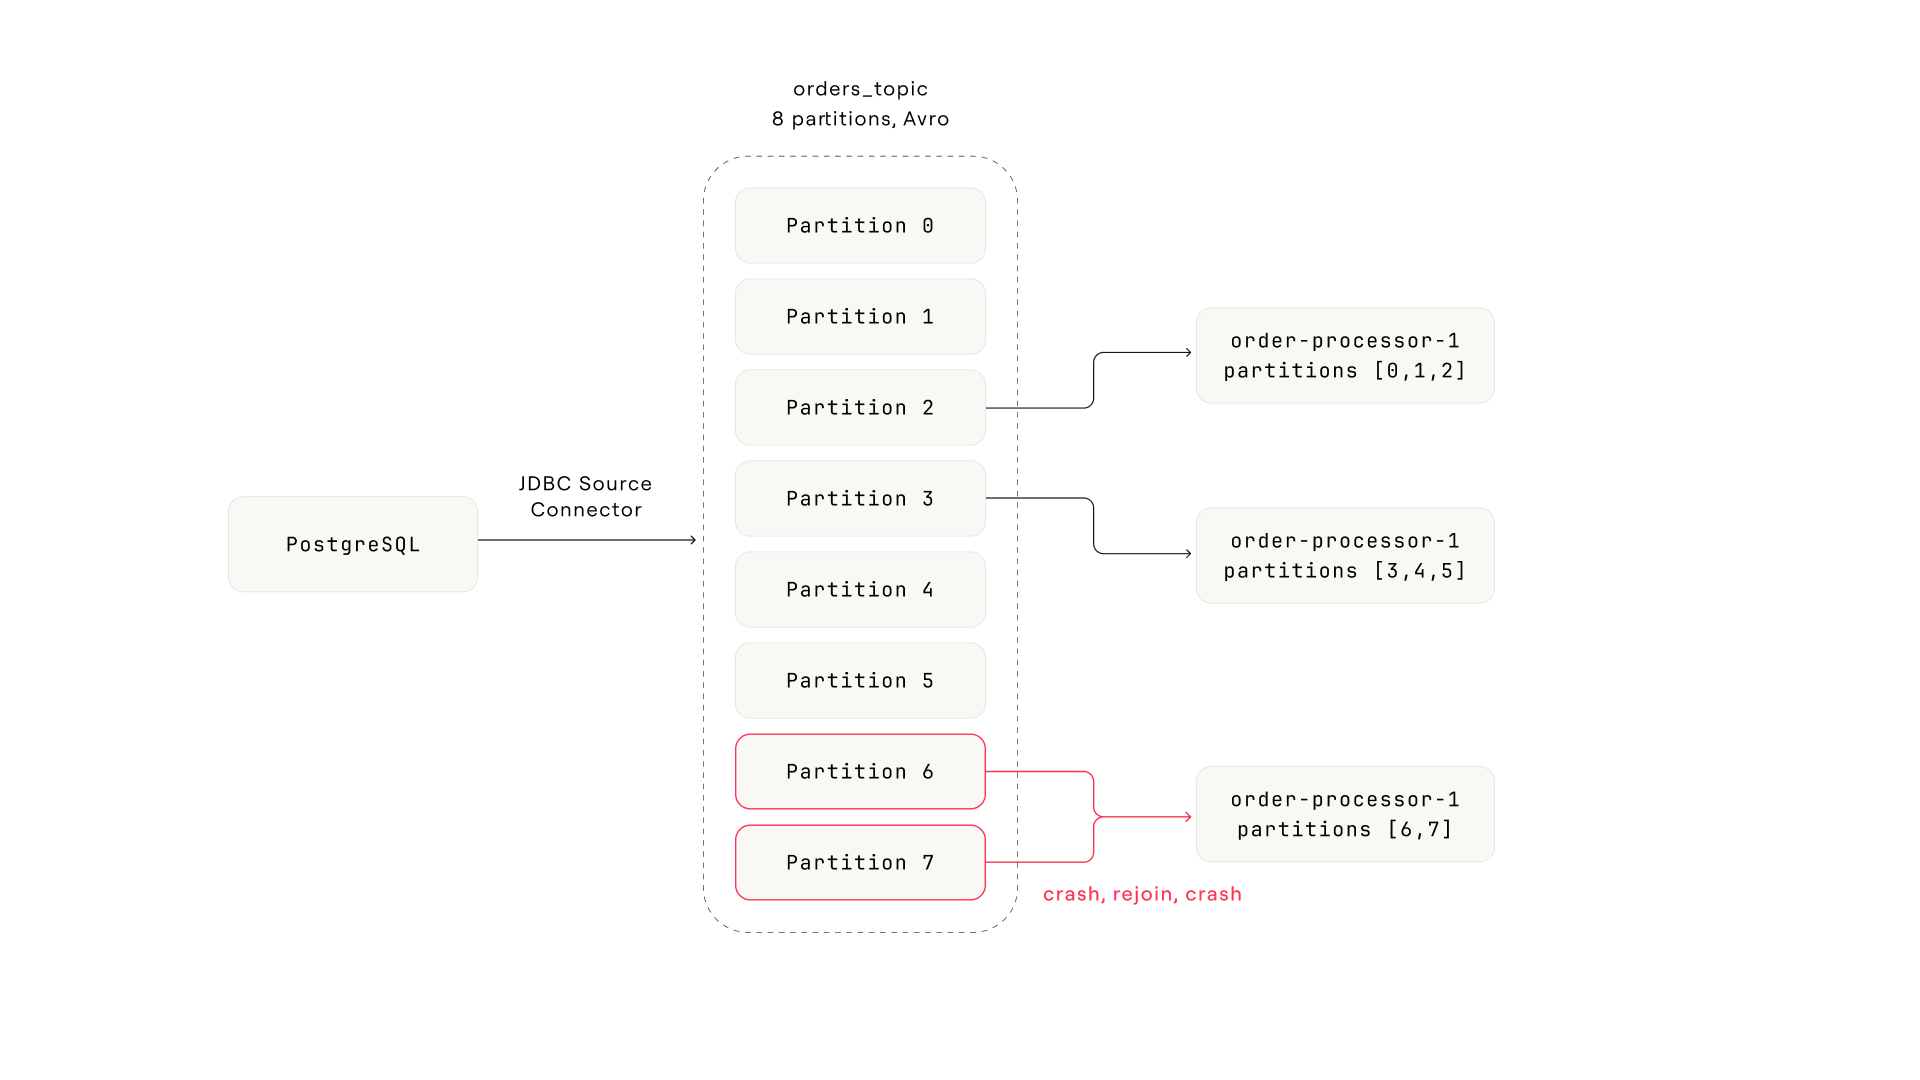
The pipeline. PostgreSQL feeds through a JDBC source connector into an 8-partition Avro topic. Three consumer instances split the partitions. Partitions 6 and 7 (assigned to instance 3) are the problem.
Sunday night, a refund order with a negative amount value lands in the database. The connector writes it to partition 7 like any other row. Monday morning, instance 3 picks up the message. The payment logic doesn't handle negative amounts. The API rejects it, the error handler treats it as fatal, the consumer crashes.
Because auto-commit is off and the consumer commits after successful processing, the offset for partition 7 never advances. On restart, the consumer pulls the same message and crashes again. This is a poison pill: a message that a consumer can't process, creating an infinite crash loop.
Why this becomes group-wide disruption
Here's where the Kafka mechanics matter. Every time instance 3 crashes, the consumer group coordinator detects the lost heartbeat and triggers a rebalance. This group uses the default eager rebalancing protocol (RangeAssignor), which means each rebalance revokes all partitions from all consumers and reassigns them from scratch. During the rebalance window, no consumer in the group processes anything. Even the two healthy instances are paused.
Instance 3 crashes every 30-60 seconds (startup time plus one failed poll cycle). Each crash triggers a rebalance. Each rebalance pauses the entire group for several seconds. The result: lag builds on partition 7 (because the offset never advances), and lag spills across the other partitions (because the healthy consumers keep getting interrupted).
Cooperative rebalancing (CooperativeStickyAssignor) or static group membership (group.instance.id) would reduce the blast radius. Only the affected partitions get reassigned, and the healthy consumers keep processing. But most consumer groups in the wild still use the default eager protocol. If yours does, a single stuck consumer becomes group-wide disruption.
Refund order with negative amount hits the database JDBC connector writes it to partition 7 like any other row
Instance 3 processes the message. Payment API rejects negative amount Error handler treats it as fatal. Consumer crashes without committing offset.
Restart pulls the same message. Crashes again. Poison pill loop. Offset never advances because commit happens after processing, and processing never succeeds.
Each crash triggers a full consumer group rebalance Eager protocol revokes all partitions from all instances. Healthy consumers pause during every rebalance.
Alert fires: consumer lag exceeds threshold across the group The symptom is group-wide lag. The cause is one message on one partition.
The alert says "consumer lag is high." That's accurate but useless for diagnosis. Here's how the six phases close the gap between the alert and the root cause.
Phase 1: Detect
The alert arrives. Where do you start?
The alert lands in Slack: consumer lag on order-processing-v2 for the orders topic has crossed the threshold. The on-call engineer sees the consumer group name and the topic.
The alert itself isn't the interesting part. The transition to investigation is. Most teams hit a handoff gap at this exact moment. The alert came from the monitoring stack (Prometheus, Datadog, PagerDuty). The investigation needs to happen somewhere else entirely. The engineer opens a terminal, types kafka-consumer-groups.sh --describe, and they're already in a different context from where the alert was. The alert tells you where to look, but the tool that can answer "why" lives somewhere else.
With native tooling
Open a terminal. SSH to a machine with the Kafka CLI. Run kafka-consumer-groups.sh --describe --group order-processing-v2. Hope you have the right bootstrap server. The investigation starts 2-5 minutes after the alert, in a completely different environment.
With Conduktor Console
The alert links directly to the consumer group view. Click through. The investigation starts in the same place the alert pointed to, with zero context switch.
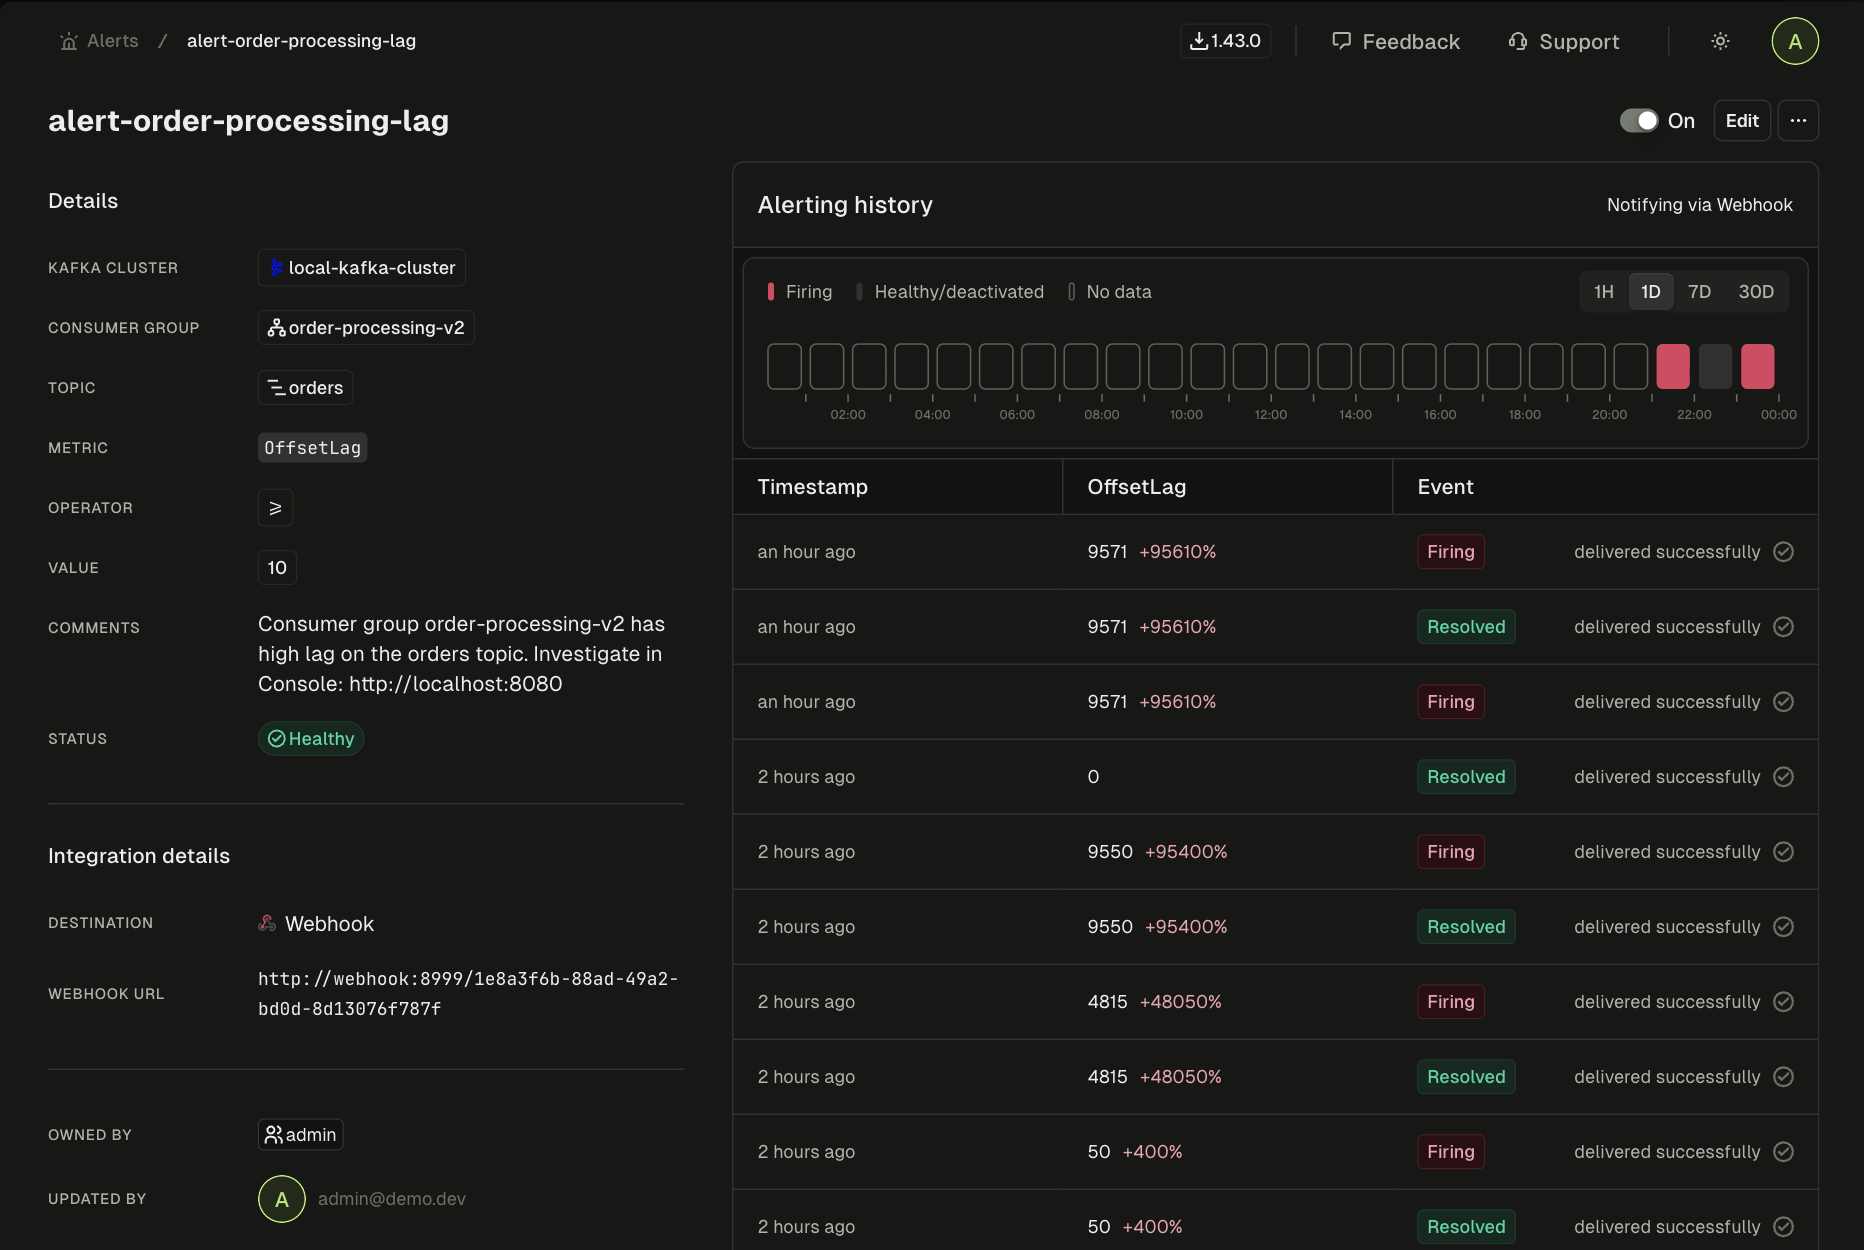
Alert detail in Console. Consumer group, topic, metric, and delivery status all in one view. The engineer clicks through from here to start investigating.
Every minute between alert and investigation is a minute where the engineer is navigating tooling, not diagnosing the problem.
Phase 2: Scope
How bad is it, and what's actually affected?
Most teams skip this phase. It's the most expensive one to skip.
Without scoping, you don't know if the problem is one partition or all eight. You don't know if lag is growing or recovering. You don't know if the consumer group is stable or mid-rebalance. Any action you take without this information is a guess.
Scoping answers three questions:
First: which partitions are affected? The consumer group has eight partitions. You need per-partition lag, not aggregate lag. An aggregate number of 12,400 could mean one partition with 12,400 lag and seven partitions at zero, or it could mean all eight partitions slowly falling behind. Completely different problems. Different root causes.
With native tooling
kafka-consumer-groups.sh --describe gives you per-partition lag as raw offset numbers. No timestamps, no growth rate. To see which consumer instance owns which partition, run a second command: --members --verbose. Different output format. You're the join engine.
With Conduktor Console
One table: partition, assigned member, current offset, end offset, offset lag, time lag. Partition 7 stands out immediately: lag of 12,400 and growing, assigned to instance 3.
In this case, per-partition lag reveals the pattern instantly. Partition 7 has massive lag and it's growing. Partition 6 has elevated but stable lag. It's also assigned to instance 3, so it's falling behind because instance 3 keeps crashing. The other six partitions show brief spikes that recover: the signature of repeated rebalances disrupting otherwise healthy consumers.
Second: what's the consumer group state? It reads "Rebalancing." Not "Stable." Something is triggering repeated rejoin cycles. If you'd jumped straight from the alert to restarting the consumer, you wouldn't know the group is mid-rebalance, and your restart would trigger yet another one. Making things worse, not better.
Third: is this acute or chronic? The lag graph shows a spike that started 30 minutes ago. But zoom out and there's a second story underneath. Lag had been creeping upward for days, well below the alert threshold but visible in hindsight. The spike is the poison pill. The drift is something else.
Consumer group detail for order-processing-v2. Per-partition lag and the lag graph over time.
Remember the drift. It has nothing to do with the poison pill. It's a separate, chronic problem: the consumer group gradually falling behind as throughput increases. It comes back in Phase 6. For now, the spike is the priority.
After Scope, the investigation has narrowed from "consumer lag is high" to "partition 7 is stuck, assigned to instance 3, group is rebalancing, and there's a chronic drift underneath." That's the search space for the next phase.
Without Scope: You open the topic and start browsing messages across all eight partitions, looking for something that looks "wrong." You don't know which partition matters, so you're searching blind. Or worse, you see the rebalance spikes on the healthy partitions and assume the problem is group-wide. Twenty minutes into investigating broker throughput when the answer is one bad message on one partition.
Phase 3: Inspect
What's at the stuck offset?
Scope told you partition 7 is stuck and gave you the committed offset. Now look at the message at that offset. This is where you go from "something is stuck" to "here is the thing that is stuck."
Open the orders topic. Filter to partition 7. Jump to the committed offset.
With native tooling
The topic uses Avro. kafka-console-consumer.sh shows binary garbage:
??orders?abc-123PENDING?L?????
You need kafka-avro-console-consumer from the Confluent distribution. A separate binary with its own Schema Registry URL, deserializer config, and authentication flags. You can technically jump to a specific offset (--offset 48293 --partition 7 --max-messages 1), but you're stitching the command together from the offset you read in a different tool, for a partition you identified in yet another tool, with flags you may not have memorized. There's no filtering, no browsing, no way to see surrounding messages for context.
With Conduktor Console
Filter to partition 7, jump to offset. Auto-decoded Avro. Every field readable. The message is right there.
Partition 7 at the stuck offset. The poison pill: ord-98765, amount -42.50, status REFUND_PENDING. The messages before and after it are normal positive amounts.
There it is. orderId: "ord-98765", amount: -42.50, status: "REFUND_PENDING". A negative amount. The messages before and after it are normal: positive amounts, standard order data. One record with a value the consumer's payment logic doesn't handle.
The consumer isn't slow or overwhelmed. It's stuck on a single message it physically can't process. The error handler treats the failure as fatal (rather than routing the message to a dead letter topic and moving on), so the consumer crashes. Auto-commit is off, commit happens after processing, and processing never succeeds, so the offset for partition 7 never advances. On restart, the consumer fetches from the last committed offset. Same message. Same crash. Textbook poison pill.
But finding the bad message isn't enough. You need to know: is this message even valid? Did the schema change to allow something it shouldn't? Or is this valid data that the consumer should have handled?
Skip Inspect and here's what happens: you see the consumer crash-looping and jump to checking the connector, the schema, the broker health. Everything looks fine because everything is fine. The problem is in the data, not the infrastructure. You waste 30 minutes ruling out causes that were never in play, because you never looked at the actual message.
Phase 4: Trace
Where did it come from, and what changed?
You have the bad message. Now trace backward: is the data valid against the schema? Did the schema change? Is the connector that produced it healthy?
Check the schema
Open the orders-value schema subject. Two versions registered. Diff them side by side:
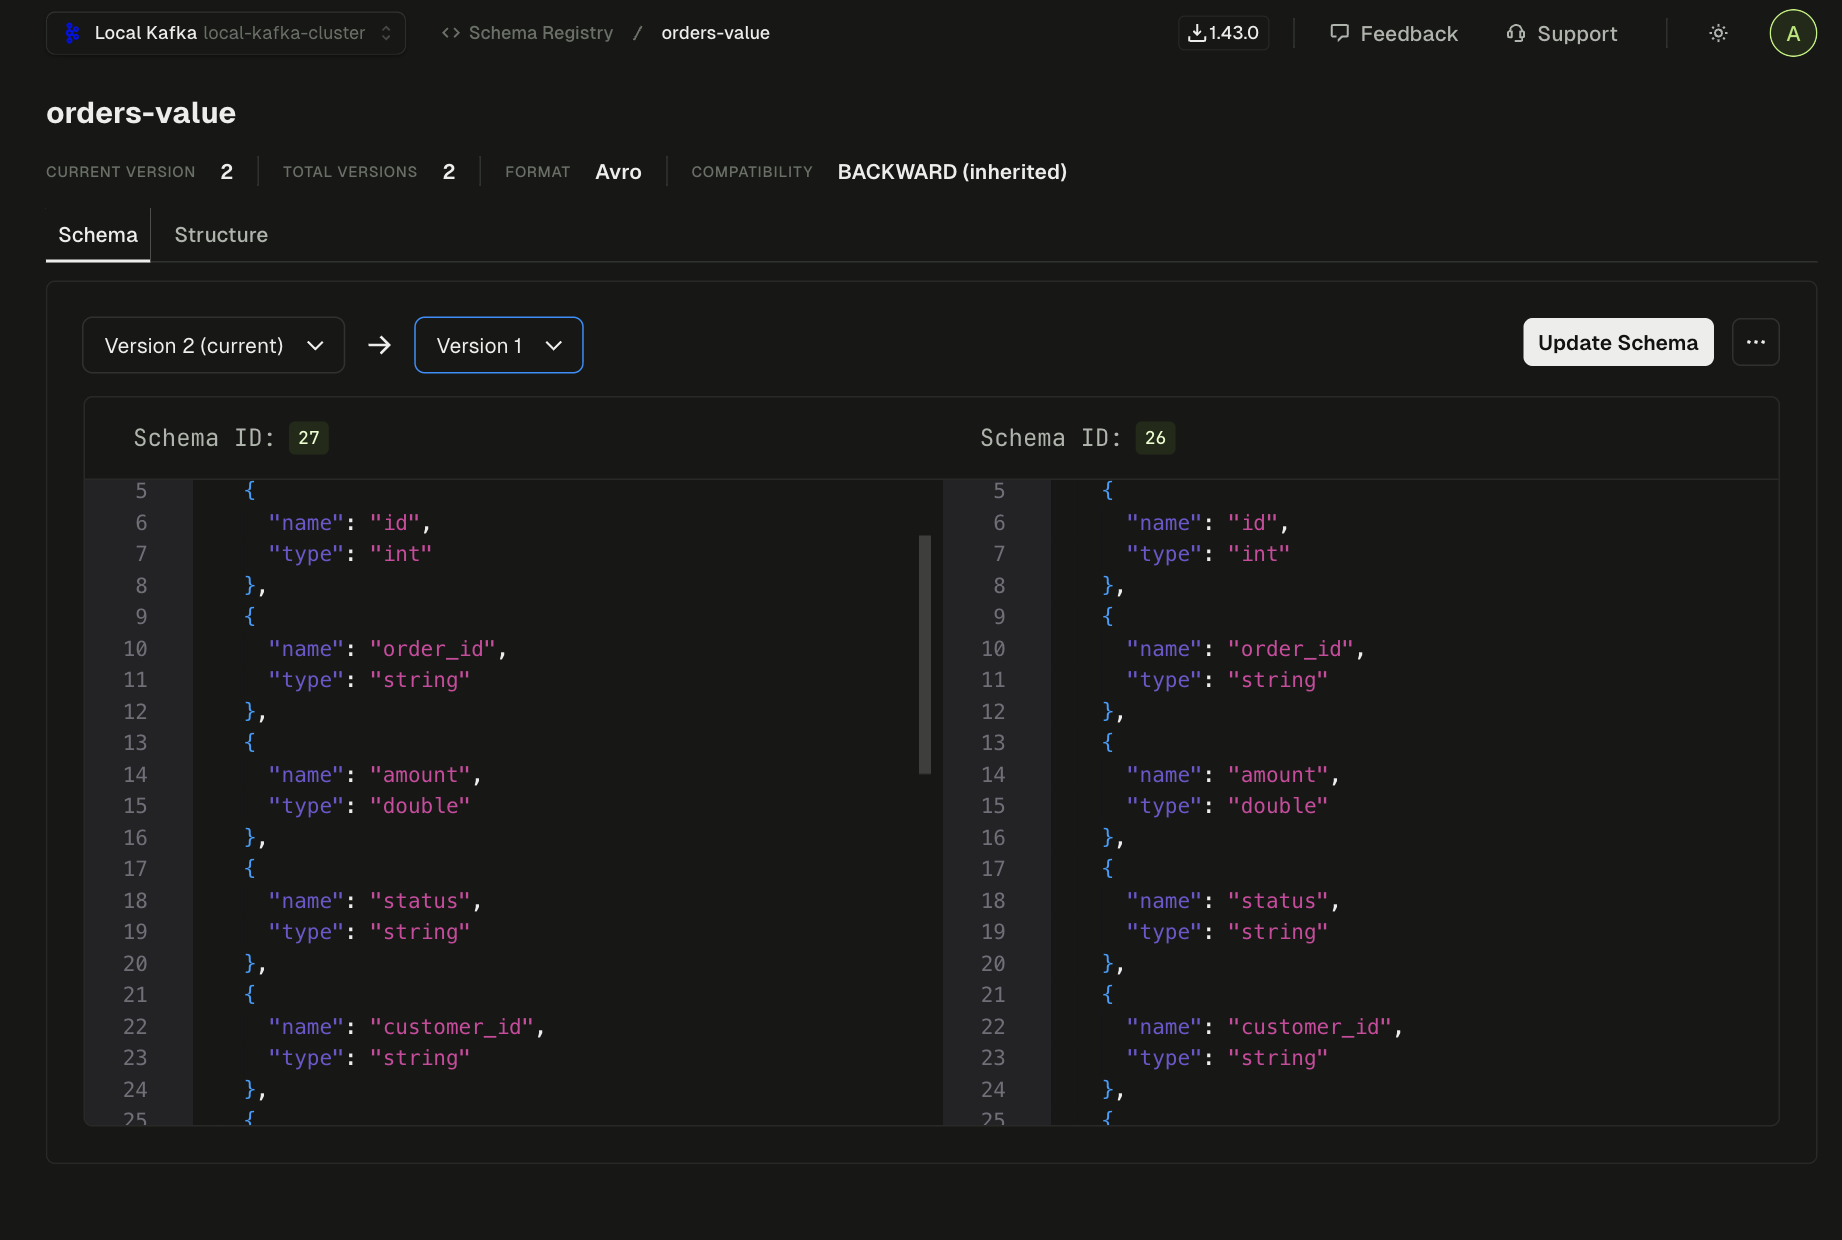
Schema subject orders-value. The amount field is a double. Compatibility mode is BACKWARD.
Version 2 added an optional notes field with a default value. The amount field is untouched, a double in both versions. Avro constrains types, not value ranges. A double accepts any 64-bit floating point number, positive or negative. The schema has no way to say "amount must be positive." A negative amount is perfectly valid. The gap is in the consumer's application logic, not the data contract.
The two versions are backward-compatible (adding an optional field with a default is always backward-compatible in Avro). Ruled out in ten seconds.
With native tooling
Two curl calls to the Schema Registry REST API. Download both versions, pipe to files, run diff. The compatibility check endpoint exists but requires a POST with escaped JSON that nobody types correctly on the first try. Most teams skip it.
With Conduktor Console
Open the schema subject. Select two versions. Side-by-side diff shows the change immediately. Compatibility check is one click.
Check the connector
The orders topic is fed by a JDBC source connector. One task, running, no errors. The connector faithfully produced what was in the database, including the refund order with a negative amount. The connector isn't the problem.
One thing to understand about Kafka Connect: it reports status at two levels. The connector level and the task level. A connector can show RUNNING while one of its tasks is FAILED. In this case, the single task is healthy. But if you'd only checked the connector-level status (which is all you get from a quick curl without expanding the task list), you'd miss a failed task entirely. Incident 2 is built around exactly this trap.
So: a single message with a negative amount that the consumer's payment logic can't process. The schema allows it. The connector produced it faithfully. The consumer is the only component that can't handle this data.
Skip Trace and you find the bad message, skip the offset past it, and call it done. The consumer unblocks. But you never checked whether the schema changed or the connector is healthy. If the schema started allowing something new, more bad messages are coming. If the connector has a problem, you're back here in an hour. Trace is what turns a quick fix into an actual root cause.
Phase 5: Resolve
Skip the poison pill. Verify the fix.
The consumer is stuck and every crash disrupts the entire group. The immediate goal is to unblock it.
Stop the consumer group. Open the offset reset panel. Select partition 7, advance the offset by one past the blocking message.
An offset reset changes the committed offset for a consumer group on a specific partition. It doesn't move or delete the message. The poison pill is still sitting at its original offset in partition 7. What changes is where the consumer starts reading next time it polls. You're telling it "skip this one, start from the next."
Get this wrong and you cause real damage. Reset the wrong partition, or reset all partitions when you meant one, and you've either skipped messages (data loss) or forced reprocessing (duplicates). The difference between a safe reset and a dangerous one is whether you can see exactly what will change before you execute.
With native tooling
kafka-consumer-groups.sh --reset-offsets --to-offset 48294 --topic orders:7 --group order-processing-v2 --dry-run
The --dry-run shows you the target offset but not what you're skipping. How many messages? What's in them? You won't know until after --execute. Also: the consumer group must be stopped first, and the CLI won't stop it for you. That's a separate operation.
With Conduktor Console
Select partition 7. Strategy: shift by 1. Preview shows exactly what changes: current offset, target offset, one message affected. Execute only after reviewing. Multiple strategies available: shift by N, to timestamp, to earliest/latest, to specific offset.
Offset reset with preview. Partition 7, shift by 1. The preview confirms: one message skipped, from offset 48293 to 48294.
Execute the reset. Restart the consumer. It picks up from offset 48,294 and processes normally. The rebalance storm stops. Lag on the other partitions clears within seconds as the healthy consumers catch up without interruption.
Before closing the incident, note the skipped message for the post-mortem: the offset, the payload, the reason it failed. In a more mature setup, the consumer itself would have dead letter topic handling: messages that fail processing N times get automatically produced to a DLT instead of blocking the partition. This group doesn't have that yet, which is precisely why the poison pill created a crash loop instead of being routed aside.
Produce a test message with a negative amount to verify the failure mode is reproducible. This confirms the eventual code fix (adding validation for negative amounts) will cover the right edge case.
Phase 6: Prevent
Find the pattern before it fires again
Remember the lag drift from Phase 2? The slow upward trend hiding underneath the spike?
That drift had nothing to do with the poison pill. The consumer group was gradually falling behind as throughput increased. Processing time per message was creeping up as the order volume grew, and the group didn't have enough instances to keep up. Nobody noticed because the drift was below the alert threshold.
If the drift had continued for another week, the same alert would have fired for a completely different reason. The engineer would have been looking for a stuck message or a dead connector when the real problem was just inadequate consumer throughput. The poison pill was the acute failure. The drift was the chronic one hiding underneath it.
Three things need to happen after this incident. The consumer needs validation for negative amounts: either handle them (route to a dead letter topic, log and skip) or fail gracefully instead of crash-looping. That's application code, not Kafka configuration.
The consumer group also needs dead letter topic handling. Any consumer doing real work per message should route unprocessable messages to a DLT after N retries. That turns a poison pill from "group-wide outage" into "one message flagged for review, processing continues."
And then there's the drift. Tune the alert threshold against the historical baseline so it fires on behavior change (lag growing faster than the trend), not when a static number is crossed. Scale the consumer group. Push the lag metrics into Prometheus and Grafana so the team's existing dashboards show what this investigation surfaced.
There's a fourth angle that most teams don't consider until after the first poison pill: data quality at the pipeline level. Instead of fixing consumers to tolerate bad data, prevent bad data from reaching them. Conduktor's data quality policies let you define rules like "amount must be positive" on the orders topic. In observe mode (Console only), violations are flagged and tracked in a dashboard after production. You'd see the negative-amount message show up as a violation, and you'd know about it before the consumer crashed. In enforce mode (with Conduktor Gateway), the message never reaches the topic. Gateway intercepts it before production and either blocks it (the producer gets an error) or marks it with a header that downstream consumers can use to route it. The poison pill would have been stopped at the gate.
If this prevention layer had been in place before Sunday night, the team would have caught the drift mid-week and scaled the consumer group before the poison pill ever arrived. And with data quality enforcement on the topic, the negative-amount message would have been blocked or flagged before any consumer saw it.
What happened
Root cause: one message with a negative amount that the consumer's payment logic couldn't handle. Symptom: lag across the entire consumer group. The distance between those two facts (one bad record and group-wide disruption) is what made this hard to diagnose with seven CLI tools and straightforward to diagnose by following the chain.
The investigation took minutes. It didn't require tribal knowledge about which CLI flags to use or which REST API endpoint returns task status. Just a sequence of questions, each answer pointing to the next.
The setup
The orders topic also feeds an Elasticsearch sink connector (es-orders-sink) that indexes every order for the customer support team's search interface. The connector has three tasks. The Connect framework assigns each task a subset of the topic's eight partitions: task 0 gets partitions [0, 1, 2], task 1 gets [3, 4, 5], task 2 gets [6, 7]. Each task maintains its own consumer position on its assigned partitions.
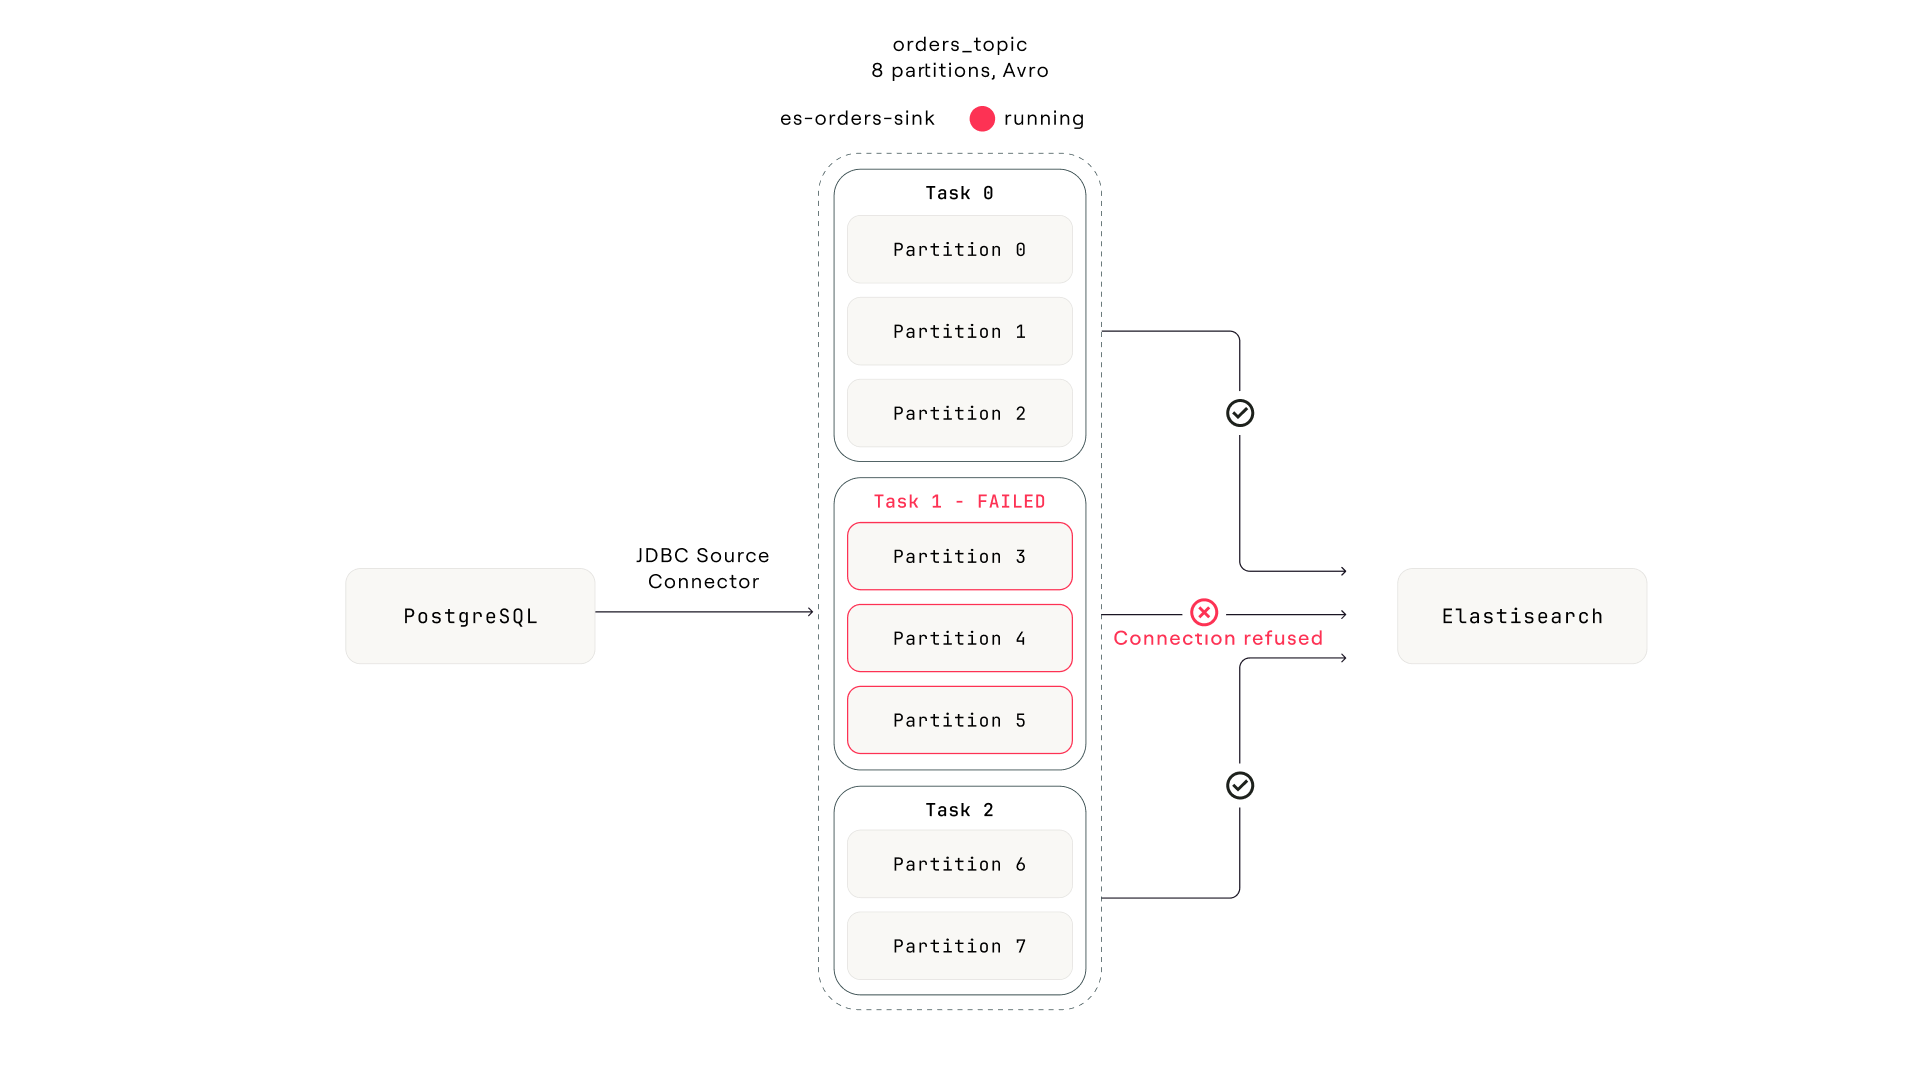
The pipeline. Everything upstream is healthy. Task 1 lost its connection to Elasticsearch during a node replacement. The connector still reports "Running."
Wednesday afternoon, the Elasticsearch cluster undergoes a brief network partition during a node replacement. Task 1's connection drops. The task encounters an unrecoverable ElasticsearchException and transitions to FAILED. Tasks 0 and 2 are connected to different Elasticsearch nodes and continue indexing normally.
Phase 1: Detect
A different consumer group, the same alert pattern
The alert fires: consumer lag on the connect-es-orders-sink consumer group is growing. This isn't the order-processing-v2 group from Incident 1. It's the sink connector's internal consumer group. Every Kafka Connect sink connector creates its own consumer group (named connect-{connector-name} by default) to track offsets on the partitions it reads from.
The on-call engineer might not immediately recognize this as a connector issue. The alert looks identical to any other consumer lag alert. The framework starts the same way regardless.
Phase 2: Scope
Lag on three partitions. The rest are fine.
Per-partition lag: partitions 3, 4, and 5 are growing steadily. The other five partitions show zero or near-zero lag. Consumer group state: Stable. No rebalances.
Two things stand out compared to Incident 1. The group is Stable. No crash loops, no rebalances. Whatever is wrong isn't causing a cascade. And lag is growing because the end offset keeps advancing (producers are still writing to all eight partitions) but the committed offset on partitions 3-5 has stopped moving. Something is consuming from five partitions but not the other three.
In Incident 1, the rebalancing state pointed toward a crashing consumer. Here, a Stable group with selective partition lag points toward something that has silently stopped. Different signal, different direction.
With native tooling
kafka-consumer-groups.sh --describe --group connect-es-orders-sink shows per-partition lag, but not which Connect task owns which partition. You'd need to cross-reference against the Connect REST API to map partitions to tasks, and the Connect API doesn't expose partition assignments directly. You'd have to infer it from task count and Connect's round-robin distribution logic.
With Conduktor Console
Per-partition lag with member assignment in one table. Partitions 3, 4, 5 are assigned to the same consumer instance (task 1's consumer thread). The lag graph shows the inflection point: 45 minutes ago, those three partitions stopped advancing.
Phase 3: Inspect
Messages are still flowing. The consumer isn't reading them.
Open the orders topic. Filter to partition 3. Fresh messages arriving every few seconds. Producers are healthy. The most recent message timestamp is seconds ago. This rules out a producer-side problem. The data is there. Something just isn't consuming it.
Now check the latest committed offset on partition 3 for the connect-es-orders-sink group. It hasn't moved in 45 minutes. Meanwhile, the end offset has advanced by thousands. The gap between committed offset and end offset is the growing lag.
Compare this to Incident 1, where the stuck offset pointed to a specific message the consumer couldn't process. Here, the message at the stuck offset is perfectly normal. The consumer just stopped reading. That's the signal to look at the consumer component itself, not the data.
Skip Inspect and you go straight to the connector. But what if the sink connector were choking on a specific record with a field Elasticsearch can't index? You'd restart the task, it would hit the same message, and fail again. Thirty seconds of checking the data tells you whether you're dealing with a data problem or an infrastructure problem.
Phase 4: Trace
The connector is "RUNNING." The task is not.
The consumer group is owned by the Elasticsearch sink connector. Open the connector in the Kafka Connect view.
Connector status: RUNNING.
And here's the trap. The connector-level status only reports whether the connector instance (the Java object that generates task configurations) is alive. It says nothing about whether the tasks are healthy. A connector with three tasks can show RUNNING while one, two, or all three tasks have failed. The connector and its tasks have independent lifecycles.
$ curl -s localhost:8083/connectors/es-orders-sink/status | jq .
{
  "name": "es-orders-sink",
  "connector": {
    "state": "RUNNING",         # ← looks fine
    "worker_id": "kafka-connect:8083"
  },
  "tasks": [
    { "id": 0, "state": "RUNNING",  "worker_id": "kafka-connect:8083" },
    { "id": 1, "state": "FAILED",   "worker_id": "kafka-connect:8083",
      "trace": "org.apache.kafka.connect.errors.ConnectException: ...
        Caused by: ElasticsearchException[connection refused] ..." },
    { "id": 2, "state": "RUNNING",  "worker_id": "kafka-connect:8083" }
  ]
}
The top-level "state": "RUNNING" is the first thing you see. During an incident with Slack pinging, it's easy to read that and move on. The failed task is buried in the tasks[] array. Expand it and there's the answer: task 1 is FAILED with ElasticsearchException: connection refused, timestamped 45 minutes ago. Exactly when the lag started.
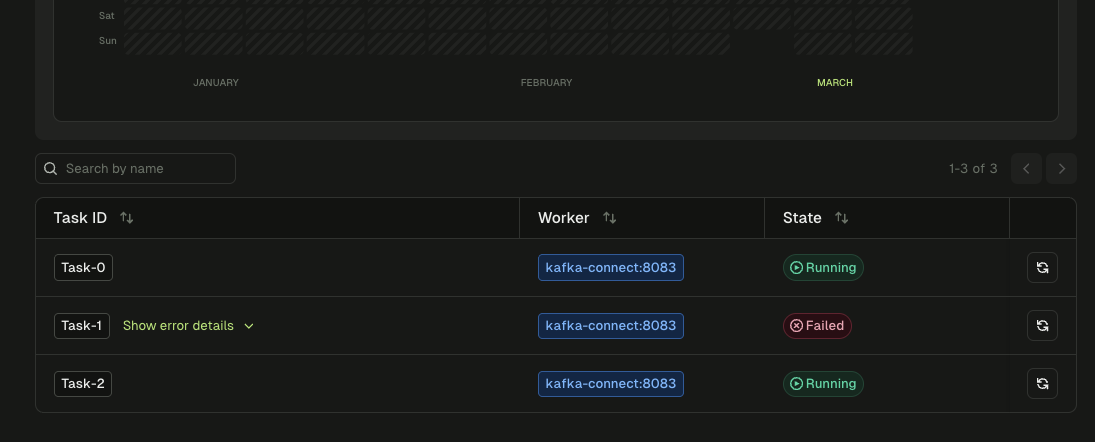
The task list for es-orders-sink. Task-0 and Task-2 are Running. Task-1 is Failed. The connector-level status still says "Running."
With native tooling
There is no dedicated CLI for Kafka Connect. You use curl:
curl -s localhost:8083/connectors/es-orders-sink/status | jq .
The JSON response nests tasks inside the connector object. A quick glance at the top-level "state": "RUNNING" is misleading. You need to parse the .tasks[] array and check each task's state individually. During an incident with Slack pinging, it's easy to see "RUNNING" and move on.
With Conduktor Console
Connector view shows each task as a separate row with its state, worker ID, and error trace. A failed task is immediately visible: red status, expandable error message, failure timestamp. No JSON parsing.
What happens to task 1's partitions depends on the Connect version and configuration. In some deployments, the remaining tasks pick up the orphaned partitions through Connect's internal rebalancing. In others, the partitions go unconsumed until the task is manually restarted. Either way, the connector-level status stays RUNNING, the failed task stays FAILED, and if the remaining tasks don't pick up the slack (or if throughput drops because fewer tasks are sharing the load), lag grows.
The core problem isn't the partition assignment. It's the visibility. The connector says it's healthy. One of its tasks is dead. No alerts fire on the connector itself. The failure is silent until either the consumer lag threshold is crossed or someone manually expands the task list. Depending on the threshold, that could be hours.
Skip Trace and you see lag on three partitions and just restart the entire connector. It works. All tasks restart, task 1 reconnects, lag clears. But you've also interrupted tasks 0 and 2, which were healthy. On a high-throughput connector, that means brief data duplication (sink connectors commit offsets periodically, so a restart replays some messages) and a gap in the Elasticsearch index. Restarting only task 1 avoids both. You can only do that if you traced the problem to a specific task.
Phase 5: Resolve
Restart the failed task. Not the whole connector.
Restart task 1 specifically. It reconnects to Elasticsearch and begins consuming from its last committed offset on partitions 3, 4, and 5. The 45-minute backlog of unindexed orders starts flowing into Elasticsearch. Lag clears as the task catches up.
With native tooling
Task-level restart requires a POST to a URL path nobody has memorized:
curl -X POST localhost:8083/connectors/es-orders-sink/tasks/1/restart
Get the task ID wrong and you restart a healthy task for nothing. There's no confirmation of what will happen before you execute.
With Conduktor Console
Click the restart button next to the failed task. The other tasks are untouched.
Before closing, verify the Elasticsearch cluster is healthy. The network partition that killed task 1 was transient. The node replacement completed and connectivity is restored. If Elasticsearch were still down, restarting the task would fail again immediately.
Phase 6: Prevent
The connector-level status is not a health check
The fix is straightforward: stop alerting on connector-level status and start alerting on task-level status. Most monitoring setups check the connector's status endpoint and alert if the connector state changes. But the connector state only changes if the connector instance fails, which is rare. Task failures are far more common, and they're completely invisible to connector-level monitoring. The alert should fire when any task transitions to FAILED.
The second problem is that vanilla Kafka Connect has no built-in automatic task restart. When a task fails, it stays FAILED until someone manually calls the restart REST endpoint. For transient failures like network blips, this means the task sits dead for hours until a human notices. Conduktor Console's auto-restart feature can restart failed tasks automatically on a configurable interval (minimum once per minute). The service checks every few seconds, detects which individual tasks have failed, and restarts them independently without touching healthy tasks. The alternative is external scripts that poll the status API, which is exactly the kind of ad-hoc tooling that accumulates and nobody maintains.
Connect's errors.tolerance and errors.retry.timeout configs handle a different problem: per-record errors within a running task (a single message that fails to serialize, for example). They don't help when the task itself fails due to an infrastructure error like a lost connection. Task-level failure and record-level failure are independent failure modes.
What happened
Root cause: an Elasticsearch network partition killed one of three sink connector tasks. The connector reported RUNNING because the connector instance was fine. The failed task's partitions went unconsumed for 45 minutes until the consumer lag threshold was crossed. The two-level status trap (connector state vs. task state) is one of the most common Kafka Connect misdiagnoses, and it's structurally invisible unless you expand the task list every time you check a connector.
The setup
A different pipeline: the user-events topic captures user activity from the web application. Producers serialize with Avro using the Confluent Schema Registry. Three consumer groups read from this topic: analytics, personalization, and fraud detection. The schema subject user-events-value is set to BACKWARD compatibility and has been stable at version 2 for months.
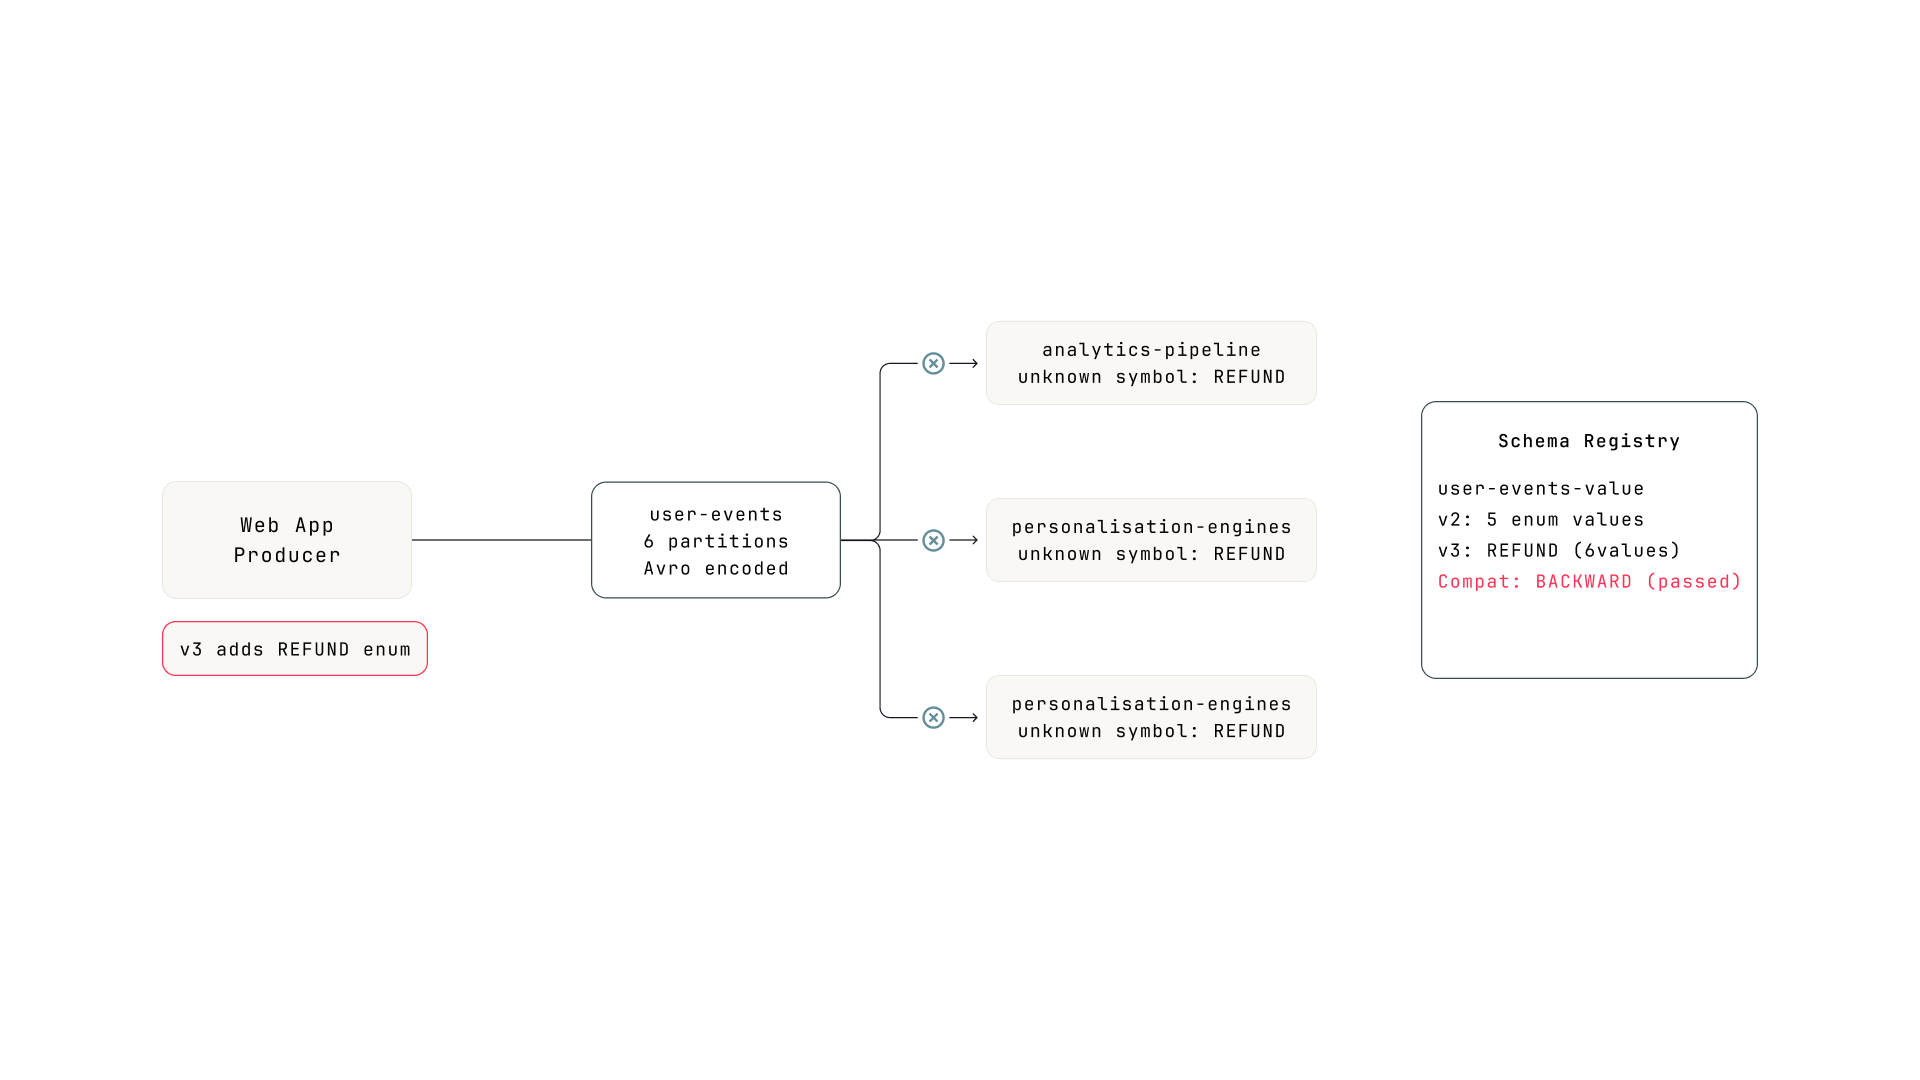
The pipeline. The producer deployed schema v3 with a new enum value in event_type. All three consumer groups are compiled with v2. The registry accepted v3 because BACKWARD compatibility passed.
Thursday morning, the product team adds refund tracking to the web application. The producer's schema for user-events-value adds a new value REFUND to the event_type enum (previously: PAGE_VIEW, CLICK, SEARCH, ADD_TO_CART, CHECKOUT). The registry checks BACKWARD compatibility: can the new consumer (v3) read old data (v2)? Yes, because v3's enum is a superset of v2's. Check passes. Schema version 3 is registered. The producer starts emitting REFUND events.
Phase 1: Detect
Three consumer groups alert at once
Within minutes, consumer lag alerts fire for all three consumer groups that read from user-events. Three alerts for the same topic is itself a signal. When multiple independent consumers fail simultaneously on the same topic, the problem is almost certainly in the data or the schema, not in the consumers themselves.
Phase 2: Scope
All partitions, all consumers, same inflection point
Pick any of the three consumer groups. All six partitions show lag climbing at roughly the same rate. Consumer group state: Stable. No rebalances, no crashed instances. The consumers are running. They're just not making progress.
The lag graph shows a clean inflection point: everything was fine until 90 minutes ago, then lag started growing linearly across all partitions. The uniformity is the signal. In Incident 1, one partition was stuck (pointing to a single message). In Incident 2, three partitions were stuck (pointing to one failed task). Here, all partitions on all consumer groups are affected equally. Something changed in the data itself.
With native tooling
Run kafka-consumer-groups.sh --describe three times, once for each consumer group. Manually compare the lag patterns. No lag history. You'd see current lag numbers but couldn't tell that all three groups started lagging at the same moment without pre-existing metrics infrastructure.
With Conduktor Console
Check each consumer group's lag graph. All three show the same inflection point at the same timestamp. The correlation is obvious.
Phase 3: Inspect
The messages look fine. The consumers can't read them.
Open the user-events topic. Browse recent messages. They look normal. Properly encoded Avro, reasonable payloads, correct timestamps. The messages aren't malformed. They aren't poison pills. The message browser can decode them because it fetches the writer schema from the registry and uses it directly.
But the consumers tell a different story. Check the consumer's application logs:
INFO  Processing batch from user-events...
INFO  offset=48201 p=2 OK (CLICK)
INFO  offset=48202 p=2 OK (PAGE_VIEW)
ERROR offset=48203 p=2 FAILED
  AvroRuntimeException:
  Unknown symbol in enum EventType: REFUND
ERROR offset=48206 p=2 FAILED
  Unknown symbol in enum EventType: REFUND
WARN  Last successful offset: 48202
WARN  First failing offset:   48203
Not every new message fails. Only the ones where event_type is REFUND. Messages with CLICK or PAGE_VIEW still deserialize fine. But refund events are arriving steadily, so the consumer keeps hitting them and stalling.
The error is specific: Unknown symbol in enum EventType: REFUND. The consumer's compiled reader schema has an enum with five values. The writer is sending a sixth value the reader doesn't know about.
To understand why the registry allowed this, you need to know how Avro enum resolution works. When the consumer's deserializer reads a message, it extracts the schema ID from the first 5 bytes (the Confluent wire format: a magic byte followed by a 4-byte schema ID), fetches the writer schema from the registry, and tries to resolve it against the consumer's compiled reader schema. For enum fields, Avro checks whether every symbol the writer sends exists in the reader's enum. If the reader doesn't have the symbol and the enum has no default, resolution fails.
  Writer schema (v3) enum EventType:
    PAGE_VIEW, CLICK, SEARCH, ADD_TO_CART, CHECKOUT, REFUND

  Reader schema (v2) enum EventType:
    PAGE_VIEW, CLICK, SEARCH, ADD_TO_CART, CHECKOUT

  Reader encounters REFUND: ╳ unknown symbol, no default defined
Worth noting how different this is from Incident 1. The poison pill was a valid message that the consumer's business logic couldn't handle. The consumer deserialized it fine, then crashed during processing. Here, the failure happens in the Kafka client library itself. The consumer can't read certain messages into a record at all. And unlike a poison pill, where one message blocks the partition, this failure is intermittent: only messages with the new enum value fail. The consumer processes some, fails on others, and lag grows unevenly.
Without Inspect, you see all consumers lagging and assume it's a throughput problem. Maybe the partition count is too low, maybe the consumers need more instances. You scale up. Lag keeps growing. Or you restart the consumers, which changes nothing because the same deserialization failure happens on the first poll() after restart. You can't distinguish "consumers are slow" from "consumers can't read the messages" without checking the data and the error logs.
Phase 4: Trace
The schema changed. The registry didn't stop it.
The deserialization errors point to a schema incompatibility. Open the user-events-value subject in the Schema Registry.
Three versions. Diff version 2 against version 3: a new value REFUND was added to the event_type enum. That's it. One new enum symbol.
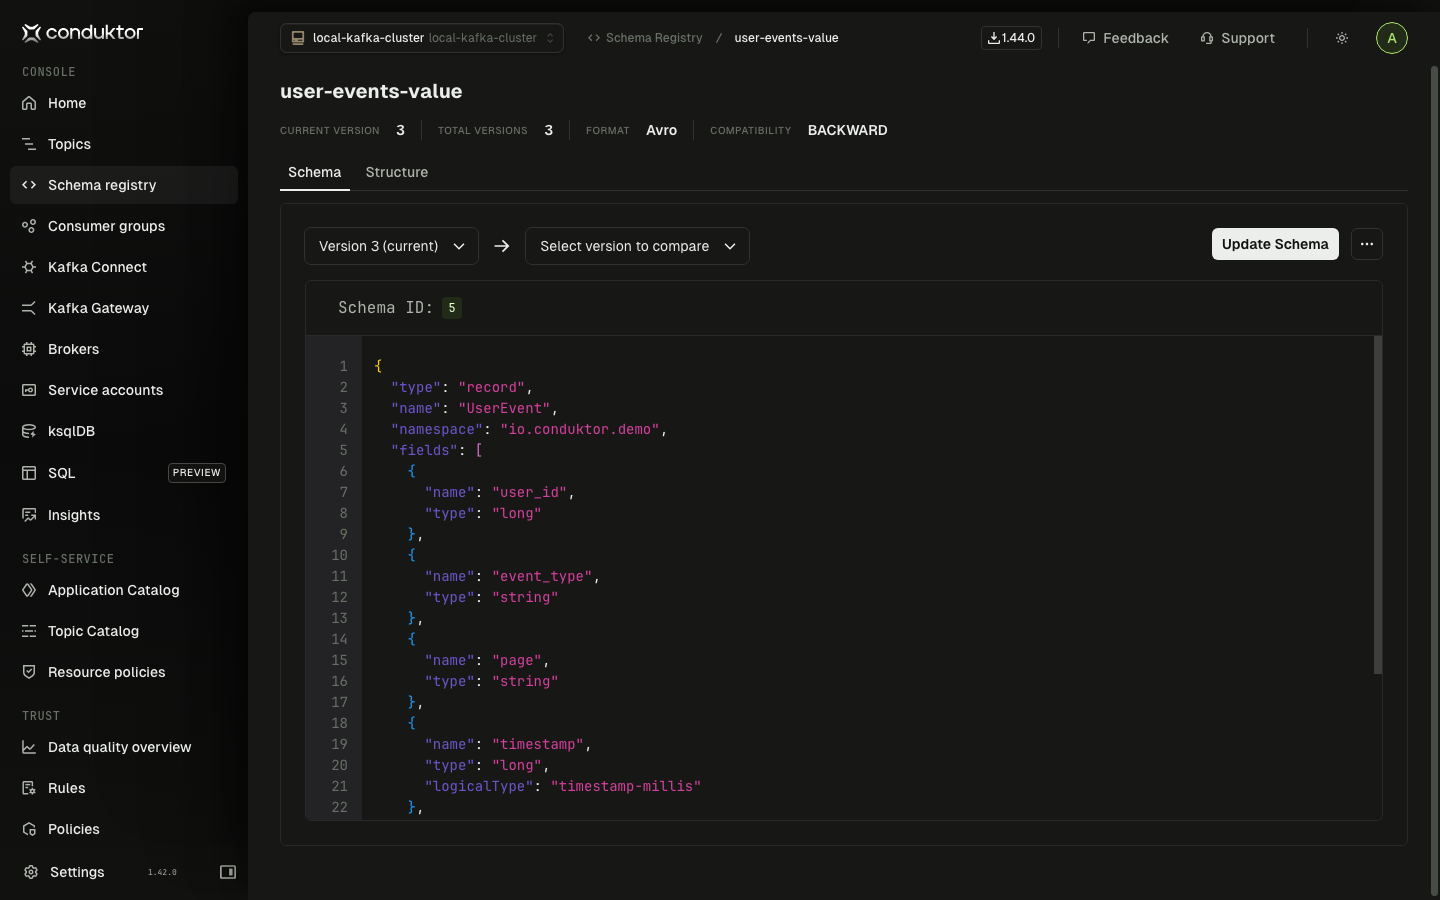
Schema version 3 of user-events-value. Compatibility is BACKWARD (top right). The registry accepted the new enum value because the BACKWARD check passed.
With native tooling
Fetch both versions with curl:
curl -s schema-registry:8081/subjects/user-events-value/versions/2 | jq .schema | jq -r . > v2.avsc
curl -s schema-registry:8081/subjects/user-events-value/versions/3 | jq .schema | jq -r . > v3.avsc
Pipe to files, run diff. The schema is returned as an escaped JSON string inside a JSON object, so you need the double jq to extract it. Spotting a single new enum value in a diff of escaped JSON during an incident is not fun.
With Conduktor Console
Open the subject. Select versions 2 and 3. Side-by-side diff highlights the new enum value immediately.
Why did the registry accept this? The subject is set to BACKWARD compatibility. BACKWARD checks whether the new consumer (v3) can read old data (v2). It can: v3's enum is a superset of v2's, so old messages deserialize fine with the new reader. Check passes.
But BACKWARD doesn't check the other direction. It doesn't ask whether old consumers (still running v2) can read new data (v3). That's FORWARD compatibility. And that check would have failed, because v2's enum doesn't include REFUND.
BACKWARD: can the new reader handle old data? FORWARD: can the old reader handle new data? FULL: both. This incident passed BACKWARD but would have failed FORWARD or FULL. In any org where producers and consumers deploy on different schedules (which is most orgs), BACKWARD alone isn't enough. You need FULL, or you need to add a default to your enums.
Skip Trace and you see deserialization errors, tell the producer team to roll back. They do. New messages stop including REFUND. But the messages already produced with REFUND are still sitting in the topic. The consumer hits them on the way through the backlog and fails again. The rollback helps going forward but doesn't fix the window of bad data already in the partitions.
Phase 5: Resolve
Two paths, depending on how fast you can deploy
If the refund tracking feature is intentional and the consumer teams can deploy quickly, update the consumers' reader schema to include REFUND in the enum. Deploy, and the consumers catch up on the backlog.
If consumer updates aren't ready, add a default to the enum in a new schema version (v4). In Avro, an enum with a default handles unknown symbols gracefully instead of throwing. Old consumers using v2 would still fail on REFUND messages, but consumers updated to v4 would map unknown symbols to the default. This buys time for the full rollout.
For the messages already in the topic with REFUND, the consumers need to handle them somehow. If the consumer has error handling that skips failed records (dead letter topic, error tolerance), it works through the backlog automatically. If not, you may need to reset offsets past the REFUND messages. For the analytics group, losing some events is acceptable. For fraud detection, probably not.
Phase 6: Prevent
BACKWARD compatibility isn't enough
The registry did its job. It checked BACKWARD compatibility and the change passed. The problem is that BACKWARD only protects one direction: new consumers reading old data. It doesn't protect old consumers reading new data. If your producers and consumers deploy on different schedules (and they almost certainly do), BACKWARD alone leaves a gap.
Switch to FULL compatibility on subjects where multiple teams consume independently. FULL checks both directions: the new schema can read old data AND old schemas can read new data. The REFUND enum addition would have failed the FULL check because old readers can't handle the unknown symbol.
Alternatively, always define a default on Avro enums. With a default, old consumers map unknown symbols to the default value instead of throwing. The data might not be perfect (a REFUND event shows up as UNKNOWN), but the consumer doesn't crash. This is a defensive coding practice that makes schema evolution safer regardless of the compatibility mode.
The producer's build pipeline should also check FORWARD compatibility before deploying, even if the registry is set to BACKWARD. The Schema Registry's /compatibility endpoint can test against specific versions: check the new schema against v2 with FORWARD mode in CI. The build fails before the schema reaches production.
What happened
Root cause: a new enum value (REFUND) added to a schema subject with BACKWARD compatibility. The registry accepted it because the new reader can handle old data. But old consumers can't handle the new value, and the enum had no default. Three consumer groups failed on every message containing REFUND. The symptom (lag growth across all partitions on all consumers, correlated with the producer deployment) was the scoping signal that pointed toward a schema change rather than a consumer or infrastructure problem.
Every one of these incidents started with a consumer lag alert. The root causes were completely different. The framework handled all three because each phase asks a question rather than checks a fixed item.
| Phase | Incident 1: Poison pill | Incident 2: Dead sink task | Incident 3: New enum value |
|---|---|---|---|
| Detect | Lag on order-processing-v2 | Lag on connect-es-orders-sink | Lag on 3 groups reading user-events |
| Scope | 1 partition stuck, group rebalancing | 3 partitions growing, group stable | All partitions, all groups, same inflection |
| Inspect | Bad message at stuck offset | Fresh messages arriving, consumer not reading | Deserialization errors on new messages |
| Trace | Schema and connector clean | Sink connector task 1 FAILED | New enum value REFUND, BACKWARD passed, FORWARD failed |
| Resolve | Skip offset by 1 | Restart task 1 only | Deploy updated consumers or register transitional schema |
| Prevent | DLT handling + drift monitoring | Task-level alerting + auto-restart | Switch to FULL compat + enum defaults + CI check |
The diagnostic chain broke at different points in each incident, and would have broken earlier with native tooling. In Incident 1, CLI tools make the Inspect phase expensive (Avro binary garbage, separate tool, manual offset navigation), so teams skip it and restart. In Incident 2, the Connect REST API hides the failed task behind a misleading connector-level RUNNING status. In Incident 3, the registry's BACKWARD check passed, so the team assumed the schema was safe. Spotting a new enum value in an escaped-JSON diff during an incident requires knowing exactly what to look for.
What you can check this week
You don't need new tooling to start closing these gaps. Four things you can audit right now:
| Check | Why it matters | How |
|---|---|---|
| Consumer group assignment strategy | If you're using the default eager protocol, one stuck consumer takes down the group (Incident 1) | Check partition.assignment.strategy in your consumer configs |
| Schema Registry compatibility settings | If any subjects are on BACKWARD instead of FULL, a new enum value can break old consumers (Incident 3) | curl your-registry:8081/config and check each subject override |
| Connect monitoring granularity | If you only alert on connector-level status, failed tasks are invisible (Incident 2) | Check whether your alerts fire on task state, not just connector state |
| Last investigation timeline | Ask your team: how long did the last Kafka incident take from alert to root cause? If the answer is hours, you're breaking the chain somewhere. | The answer tells you which phase is the bottleneck |
Teams that default to "restart and hope" aren't lazy or unskilled. They're making a rational economic decision: the cost of investigating with native tools exceeds the cost of restarting. The framework doesn't work by asking teams to try harder. It works when the cost of each phase drops low enough that following the chain is faster than skipping it.
That's what Conduktor Console changes. Not the framework itself. The framework is just a sequence of questions. What changes is the cost of answering each one. When the cost is low enough, teams stop breaking the chain.
Keep reading the full playbook
Three worked incidents with Kafka mechanics, terminal output, and CLI vs Console comparisons at every phase.