
We've spent two posts building a case.
First: most Kafka teams are stuck in a loop. Alerts fire, dashboards confirm the symptom, nobody can find the cause, someone restarts the consumer.
Second: even when you commit to debugging, the native CLI tools fight you every step. Seven tools, seven separate contexts, disconnected output formats. That post walked through a consumer lag investigation step by step and showed how each step requires a different tool, a different output format, and a person who's memorized the incantations.
In this post, let's see how Conduktor Console handles the same kind of investigation with the same alert and the same questions.
The setup
Here's the pipeline:
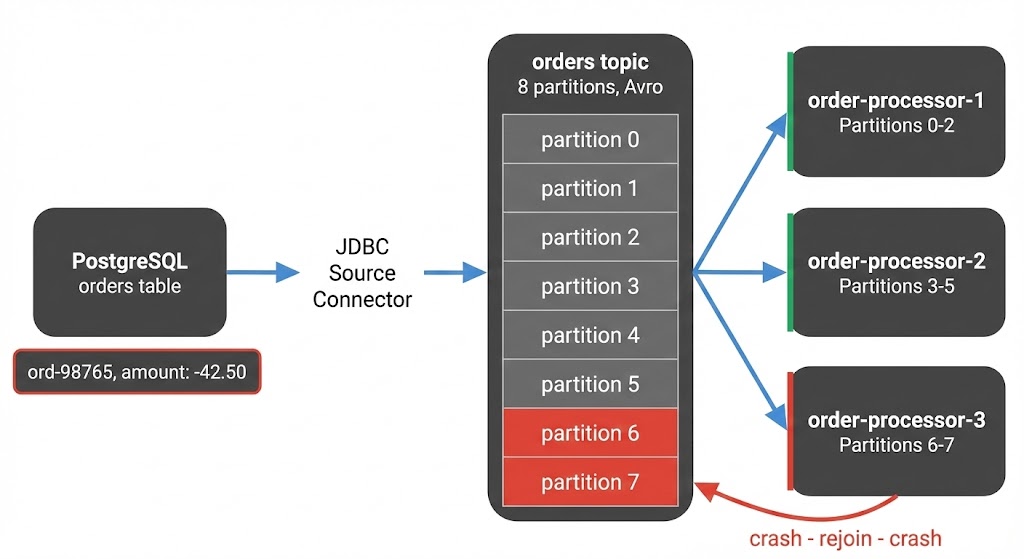
A JDBC source connector reads from PostgreSQL and writes Avro-encoded messages to the orders topic. Downstream, three consumer instances in order-processing-v2 process each message: payment API calls, inventory updates, then commit.
Sunday night, a refund order with a negative amount value lands in the database. The connector writes it to partition 7 like any other row.
Monday morning, instance 3 picks up the message:
- The payment logic doesn't handle negative amounts
- The API rejects it, the error handler treats it as fatal, the consumer crashes
- No offset committed - on restart it pulls the same message and crashes again
Every crash triggers a rebalance that briefly pauses the other instances. Lag builds on partition 7 and spikes across the rest.
The alert fires.
The alert
Whether the alert comes from your monitoring stack, PagerDuty, or a Slack message from someone who noticed, the question is always the same: now what? You know lag is spiking. You need to find out why.
Open Console. Navigate to the consumer group. You're already looking at the problem.
Step 1: See the consumer group
With the CLI, you'd run kafka-consumer-groups.sh --describe and get raw offset numbers. Lag per partition, no member info, no history, no timestamps. To see which consumer instance owns which partition, you'd need a separate command (--members --verbose) with a different output format, then cross-reference the two yourself.
In Console, you land on the consumer group detail view. All eight partitions in one table:
- Assigned member
- Current offset
- End offset
- Offset lag
- Time lag
No cross-referencing. No second query.
- Partitions 6-7: lag growing steadily. The committed offset hasn't moved, but producers keep writing. These are both assigned to instance 3.
- Other partitions: brief lag spikes that recover every few minutes. The rebalance disruptions from instance 3's crash loop.
Consumer group detail view: per-partition lag, member assignments, and the lag graph all in one place.
The lag graph confirms it. Partitions 6 and 7 have been climbing steadily for 30 minutes - both owned by instance 3. The other partitions spike briefly (each rebalance) but recover. One consumer stuck, the rest healthy between disruptions.
Time to look at the messages on those stuck partitions.
Step 2: Look at the messages
With the CLI, you'd run kafka-console-consumer.sh to read from partition 7. If the topic uses Avro (and the orders topic does), you'd see binary garbage:
??orders?abc-123PENDING?L?????You'd need a different tool entirely (kafka-avro-console-consumer) from a separate distribution with its own flags for Schema Registry URLs and deserializers. And even then you still couldn't filter. There's no way to say "show me messages around the stuck offset on partition 7."
In Console, you note the committed offset from the consumer group view and open the orders topic. Filter to partition 7 and jump straight to that offset. The message is auto-decoded Avro with every field readable:
Filtering to partition 7 at the stuck offset, the poison pill is right there: ord-98765, amount -42.50.
orderId: "ord-98765"amount: -42.50status: "REFUND_PENDING"
A negative amount. The messages before and after it are normal, positive amounts, standard order data. One record with a value the consumer's payment logic doesn't handle.
The consumer isn't slow. It's stuck on a single message it can't process, and every crash triggers a rebalance that disrupts the entire group.
But is the negative amount even valid? Did the schema change to allow something it shouldn't?
Step 3: Check the schema
With the CLI, there's no schema CLI in the Kafka distribution. You'd hit the Schema Registry REST API with curl. One call for the latest version, one for the previous, then pipe both to files and run diff. The compatibility check endpoint exists but requires escaped JSON that nobody types correctly on the first try.
In Console, you open the orders-value subject:
- All versions listed
- Select two to compare: side-by-side diff like an IDE
- The only change is an optional field added.
amountis untouched. amountis adouble. Avro doesn't constrain value ranges, just types. A negative number is valid.
Compatibility check passes. The schema is clean and amount hasn't changed.
So the schema allows negative amounts. Either this is expected data that the consumer should handle or something upstream is producing values it shouldn't. Either way, the schema isn't the cause.
Where did this message come from?
Step 4: Check the source
The orders topic is fed by a JDBC source connector reading from PostgreSQL. If the connector introduced bad data or is having its own problems, that's worth knowing.
With the CLI, there is no CLI. You'd curl the Connect REST API and parse JSON with connector status, task statuses, and error traces all buried in nested responses.
In Console, you open the Kafka Connect section and find the JDBC source connector. One task: Task 0, RUNNING, no errors. The connector is healthy. It produced what was in the database, including the refund order.
 Kafka Connect in Console: the JDBC source connector is healthy - 1 task running, 0 failures.
The problem isn't the connector. It faithfully produced what was in the database, including the refund order with a negative amount. The consumer is the only component that can't handle it.
Root cause: a single message with a value the consumer's payment logic doesn't expect.
If a connector task had failed from a database connection issue, you'd see that here too. Each task is listed with its status and a failed task shows the exact exception, timestamp, and worker ID in an expandable row. You restart just that task with a button click instead of curl -X POST to a URL you have to look up.
Step 5: Unblock and recover
With the CLI, you'd reset offsets using kafka-consumer-groups.sh --reset-offsets with --dry-run. The dry run shows target offsets but not how many messages you're skipping or what's at those offsets. Then swap --dry-run for --execute and hope your math was right. On production.
The immediate problem: the consumer is stuck and every crash disrupts the entire group.
In Console, you stop the consumer group and open the offset reset panel:
- Select partition 7
- Strategy: advance the offset by one, past the blocking message
- The preview table shows exactly what changes: current committed offset, target offset, one message skipped
Offset reset in Console: select partition 7, preview the change, execute. One message skipped, consumer unblocked.
Execute. Restart the consumer. It picks up from the next message and continues normally. The rebalance storm stops. Lag on the other partitions clears within seconds.
As your Kafka usage grows, you'd route messages like this to a dead letter topic automatically so nothing gets silently lost. For now, the skipped message is noted for manual review, and a consumer update later adds validation for negative amounts.
What just happened
The entire investigation took minutes:
- Alert fires → open Console, go to the consumer group
- Per-partition lag → identified partitions 6-7 (instance 3) as stuck, narrowed to partition 7
- Message browser → found the exact message the consumer couldn't process
- Schema check → confirmed the data is schema-valid, ruled out a schema change
- Connector check → confirmed the source is healthy
- Offset reset with preview → skipped past the blocking message, unblocked the group
The root cause was a single message with a value the consumer's business logic didn't handle. The symptom was consumer lag across the entire group. One stuck partition triggered a cascade of rebalances that disrupted everything.
With the CLI, the previous post showed how this kind of investigation requires seven different tools and REST API calls nobody memorizes.
In Console, every step was in the same place. Anyone on the team could have done this, not just the person who's been on-call long enough to know the tricks.
This is what we built Console for
Kafka is well-designed infrastructure. It's the debugging experience that hasn't kept up.
Everything shown in this post is available in the free Community Edition of Conduktor Console. Self-hosted and works with whatever flavor of Kafka you run:
- Message browsing and filtering
- Auto-decoding Avro and Protobuf
- Consumer group lag with per-member detail
- Connector task management
- Schema version diffs and compatibility checks
- Offset reset with preview
This is part of a series on Kafka debugging.
- Part 1: Why Every Kafka Incident Ends with "Restart It"
- Part 2: Houston, We Have 7 CLI Tools and Zero Answers
- Part 3: This post
Want the full framework? This series became The Kafka Debugging Playbook — three production incidents walked through from alert to root cause, with CLI vs Console comparisons at every phase.