DataOps for Streaming: Operational Excellence in Real-Time Systems
As organizations increasingly rely on real-time data streaming for critical business operations, the need for strong operational practices has grown. DataOps — the application of DevOps principles to data systems — provides the methodology and tooling to deliver streaming systems with speed, quality, and reliability. 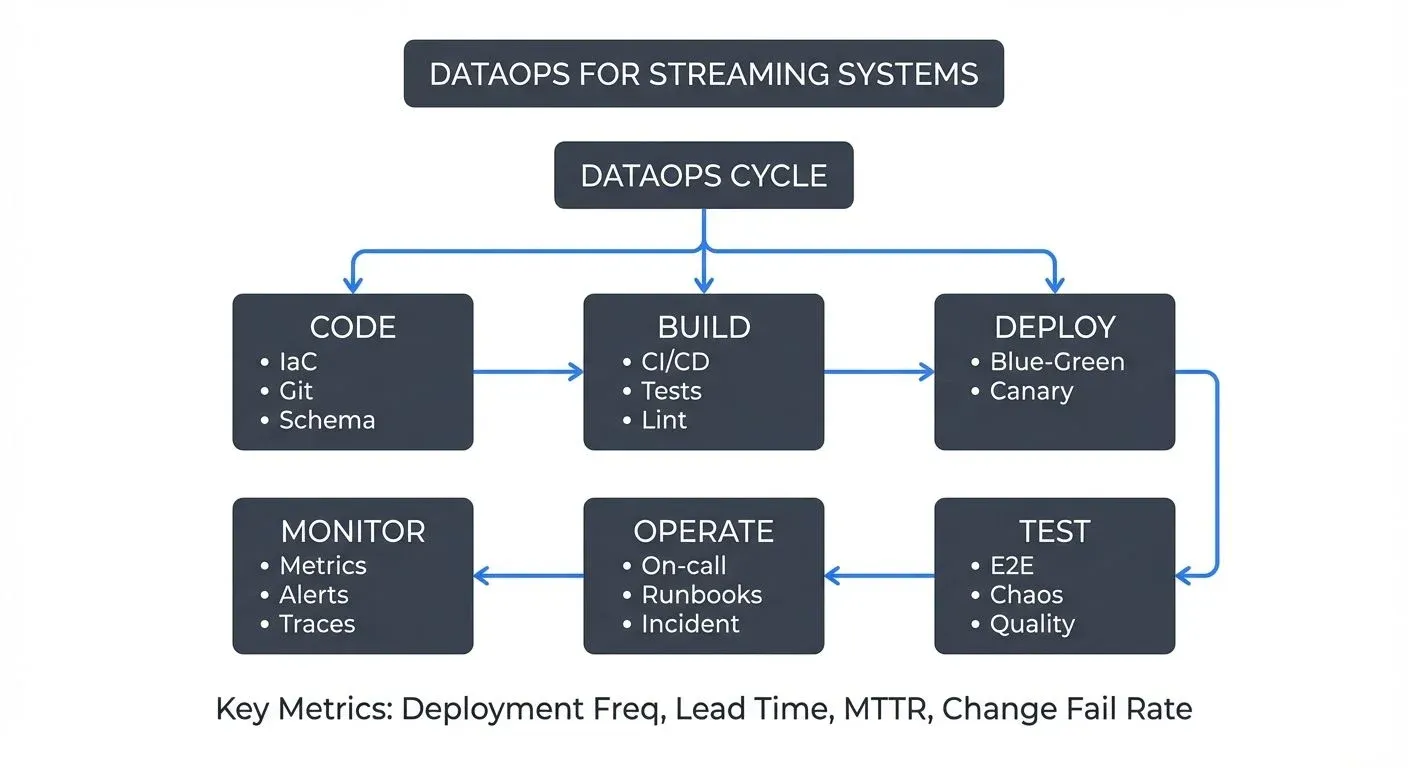
What is DataOps?
DataOps is a collaborative, process-oriented methodology that brings together data engineers, platform teams, and stakeholders to improve the quality, speed, and reliability of data analytics and pipelines. Drawing from DevOps, Agile, and lean manufacturing principles, DataOps emphasizes:
- Automation: Reducing manual intervention through CI/CD, infrastructure as code, and automated testing
- Collaboration: Breaking down silos between data engineering, platform operations, and business teams
- Continuous improvement: Iterative development with rapid feedback loops
- Quality focus: Built-in testing, monitoring, and validation at every stage
- Observability: Comprehensive monitoring and alerting to detect and resolve issues quickly
For batch-oriented data systems, DataOps has proven valuable. For streaming systems operating 24/7 with millisecond latencies, it becomes essential.
Why Streaming Demands DataOps
Streaming architectures present unique operational challenges that make DataOps practices critical:
- Continuous operation: Unlike batch jobs that run on schedules, streaming pipelines operate continuously. A deployment error or configuration drift can immediately impact downstream consumers, making automated testing and safe deployment strategies non-negotiable.
- Complex dependencies: Streaming systems involve multiple components, message brokers, stream processors, state stores, connectors, each with their own configurations, versions, and operational characteristics. Managing this complexity manually is error-prone and doesn't scale.
- Real-time requirements: When data must flow within seconds or milliseconds, there's no room for lengthy manual reviews or slow deployment processes. Automation enables teams to move fast while maintaining reliability.
- Stateful processing: Many streaming applications maintain state, making deployments and scaling more complex than stateless services. DataOps practices help manage state migrations, backups, and recovery procedures systematically.
Core DataOps Practices for Streaming
Infrastructure as Code
Treating infrastructure configuration as versioned code is foundational to DataOps. For streaming systems, this means:
Declarative definitions: Define Kafka topics, schemas, connectors, stream processing applications, and their configurations in code using tools like Terraform, Pulumi, or Kubernetes operators.
# Example using Terraform Kafka provider
terraform {
  required_providers {
    kafka = {
      source = "Mongey/kafka"
      version = "~> 0.7"
    }
  }
}

resource "kafka_topic" "user_events" {
  name = "user.events.v1"
  partitions = 12
  replication_factor = 3

  config = {
    "retention.ms"      = "604800000"
    "cleanup.policy"    = "delete"
    "compression.type"  = "lz4"
    "min.insync.replicas" = "2"
  }
}- Version control: Store all infrastructure definitions in Git, enabling change tracking, code review, and rollback capabilities.
- Reproducibility: Deploy identical environments for development, staging, and production from the same codebase, reducing environment-specific bugs.
- KRaft-aware configuration: With Apache Kafka's move to KRaft mode (production-ready since 3.3, mandatory in 4.0+), infrastructure code should target KRaft-based clusters rather than ZooKeeper-dependent configurations. This simplifies operations by removing ZooKeeper management from your DataOps workflows and enables faster metadata operations.
Automated Testing Strategies
Comprehensive testing ensures streaming applications behave correctly before reaching production:
Unit testing: Test individual stream processing functions in isolation. For Kafka Streams applications, the TopologyTestDriver (a Kafka Streams testing utility) enables fast, local testing without external dependencies.
// Example: Testing a Kafka Streams topology
TopologyTestDriver testDriver = new TopologyTestDriver(topology, config);
TestInputTopic<String, String> inputTopic =
    testDriver.createInputTopic("input-topic", stringSerde, stringSerde);
TestOutputTopic<String, Long> outputTopic =
    testDriver.createOutputTopic("output-topic", stringSerde, longSerde);

inputTopic.pipeInput("key1", "value1");
assertEquals(1L, outputTopic.readValue());- Integration testing: Validate interactions between components using embedded brokers or containerized environments (Testcontainers with Kafka). Test schema compatibility, serialization, error handling, and state management. Verify data quality rules are enforced at pipeline boundaries.
- End-to-end testing: Deploy complete pipelines in staging environments and validate end-to-end behavior with realistic data volumes and patterns. Test failover scenarios, exactly-once semantics, and recovery from failures.
- Property-based testing: Generate test cases automatically to verify streaming application properties hold across diverse inputs and edge cases.
CI/CD for Streaming Pipelines
Continuous integration and deployment pipelines automate the path from code commit to production:
Automated builds: Compile applications, run tests, and build container images on every commit. Fail fast when tests don't pass.
# Example: GitHub Actions workflow for Kafka Streams application
name: CI/CD Pipeline
on: [push]
jobs:
  test-and-build:
    runs-on: ubuntu-latest
    steps:
      - uses: actions/checkout@v4
      - name: Set up JDK 21
        uses: actions/setup-java@v4
        with:
          java-version: '21'
      - name: Run unit tests
        run: ./gradlew test
      - name: Build Docker image
        run: docker build -t myapp:${{ github.sha }} .
      - name: Push to registry
run: docker push myapp:${{ github.sha }}- Deployment automation: Use GitOps tools like ArgoCD or FluxCD to automate deployments to Kubernetes clusters, ensuring production matches your Git repository state. Traditional CI/CD platforms like Jenkins or GitHub Actions can also orchestrate deployments.
- Configuration validation: Automatically validate topic configurations, schema compatibility, and application settings before deployment. Tools like Conduktor can validate configurations against governance policies and operational best practices.
- Gradual rollouts: Implement deployment patterns that minimize risk and enable quick rollback.
Deployment Patterns for Streaming
Safe deployment strategies are crucial when applications process continuous data streams:
Blue-Green Deployments: Run old and new versions of an application simultaneously, routing traffic to the new version only after validation. For streaming, this means both versions consume from the same topics with different consumer groups, allowing instant rollback by switching active consumers.
// Example: Blue-green deployment with consumer groups
// Blue (current): consumer-group-v1
// Green (new): consumer-group-v2
// Both consume same topics, switch traffic via routing logic
Properties config = new Properties();
config.put(ConsumerConfig.GROUP_ID_CONFIG, "consumer-group-v2"); // Green version- Canary Deployments: Deploy new versions to a small subset of instances first, monitoring metrics and error rates before rolling out to all instances. For Kafka Streams applications, this might mean directing a single partition to the new version initially. Monitor consumer lag and error rates closely during canary phases.
- Rolling Deployments: Gradually replace old instances with new ones, maintaining availability throughout. Critical for stateful applications where state must be migrated or rebuilt during deployment. Kafka Streams handles state store migrations automatically, but monitor state restoration progress and backpressure during transitions.
- Shadow Mode: Run new versions alongside production, processing the same data but without affecting downstream systems, enabling validation with production traffic before full deployment. Use separate output topics for shadow deployments to compare results without impacting downstream consumers.
Monitoring and Observability
Comprehensive observability enables teams to understand system behavior and quickly identify issues:
- Metrics collection: Track application-level metrics (processing rate, latency, error rate) and infrastructure metrics (CPU, memory, network, disk) using tools like Prometheus, Datadog, or New Relic. Kafka exposes JMX metrics that should be scraped and monitored continuously.
- Key performance indicators: Monitor consumer lag (how far consumers are behind producers), throughput, end-to-end latency, and error rates. Set SLOs (Service Level Objectives, quantifiable targets like "99.9% of messages processed within 500ms") and alert when they're breached.
# Example: Prometheus alerting rule for consumer lag
- alert: HighConsumerLag
  expr: kafka_consumer_lag > 10000
  for: 5m
  labels:
    severity: warning
  annotations:
summary: "Consumer group {{ $labels.group }} has high lag"- Distributed tracing: Implement tracing across streaming pipelines to understand request flows and identify bottlenecks. Modern observability uses OpenTelemetry (the industry-standard successor to OpenTracing/OpenCensus) with backends like Jaeger, Tempo, or cloud-native solutions. Trace context propagation through Kafka message headers enables end-to-end visibility.
- Log aggregation: Centralize logs from all components using ELK stack (Elasticsearch, Logstash, Kibana), Splunk, or cloud-native solutions. Structured logging enables efficient querying during incident investigation.
- Dashboards: Create role-specific dashboards for operators, developers, and business stakeholders. Visualize pipeline health, data flow, and business metrics in real-time. Tools like Conduktor provide purpose-built dashboards for Kafka operations, complementing general-purpose monitoring platforms.
Incident Response and On-Call Practices
When issues occur in 24/7 streaming systems, rapid response is essential:
Runbooks: Document common failure scenarios and remediation steps. Include commands for scaling, restarting, and rollback procedures.
# Example runbook entry
## High Consumer Lag Alert

- **Symptoms**: Consumer lag > 10,000 messages for > 5 minutes
- **Impact**: Delayed data processing, potential SLA breach
- **Investigation Steps**:

1. Check consumer health: `kafka-consumer-groups --describe --group <group-id>`
2. Verify partition distribution and rebalancing
3. Check for slow processing (CPU, GC, external dependencies)
4. Review error logs for exceptions

**Remediation**:
- Scale consumers horizontally if capacity-limited
- Restart stuck consumers
- Increase processing parallelism if I/O-bound
- Rollback recent deployment if regression introduced- Alerting strategy: Configure alerts that are actionable and minimize false positives. Alert on symptoms (high latency, errors) rather than just causes (high CPU). Follow the consumer lag monitoring best practices for streaming-specific alerting.
- On-call rotation: Establish clear on-call responsibilities with escalation paths. Ensure on-call engineers have access to necessary tools and documentation.
- Post-incident reviews: Conduct blameless postmortems after incidents to identify root causes and prevent recurrence. Document learnings and update runbooks.
- Chaos engineering: Proactively test system resilience by injecting failures in non-production environments, validating failover mechanisms and recovery procedures. Tools like Conduktor Gateway enable controlled failure injection (network delays, message corruption, broker failures) without modifying application code. See chaos engineering for streaming systems for comprehensive testing strategies.
Cross-Team Collaboration
DataOps success depends on effective collaboration across organizational boundaries:
- Shared ownership: Data engineers and platform teams jointly own streaming systems' reliability and performance.
- Self-service platforms: Build internal platforms that let data teams provision infrastructure, deploy applications, and monitor systems without constant platform team involvement. Platform teams provide guardrails and observability while data teams move independently.
- Clear interfaces: Define clear contracts between teams through schemas, APIs, and SLAs. Governance frameworks help establish practices that clarify data ownership, access policies, and quality standards across streaming platforms. Schema registries enforce compatibility rules, preventing breaking changes from propagating to consumers.
- Knowledge sharing: Regular demos, documentation, and training sessions ensure teams stay aligned on best practices and platform capabilities.
DataOps Tooling Ecosystem
Modern DataOps relies on a rich ecosystem of tools:
- Infrastructure as Code: Terraform, Pulumi, CloudFormation for provisioning cloud resources and Kafka infrastructure; Kubernetes operators for declarative Kafka cluster management
- CI/CD: GitHub Actions, GitLab CI, Jenkins for automated testing and builds; ArgoCD, FluxCD for GitOps-based deployment orchestration
- Containerization: Docker for packaging streaming applications; Kubernetes for orchestration with horizontal pod autoscaling and rolling updates
- Monitoring: Prometheus + Grafana for metrics collection and visualization; Datadog, New Relic for comprehensive observability platforms; JMX exporters for Kafka-specific metrics
- Observability: OpenTelemetry for instrumentation and trace context propagation; Jaeger, Tempo, or Zipkin for distributed tracing backends; ELK stack (Elasticsearch, Logstash, Kibana) or Splunk for log aggregation
- Schema management: Schema Registry (open-source or managed) for Avro/Protobuf/JSON Schema versioning; AWS Glue Schema Registry for AWS-native workflows; schema compatibility validation in CI pipelines
- Kafka operations and governance: Conduktor for comprehensive Kafka management, monitoring, data exploration, and governance; Conduktor Gateway for proxy-based security, chaos testing, and policy enforcement; UI tools like Kafka UI, AKHQ for operational visibility
- Testing: Testcontainers for integration testing with real Kafka brokers; TopologyTestDriver for Kafka Streams unit testing; Conduktor Gateway for chaos engineering and failure injection
- Security: Vault, AWS Secrets Manager for credential management; cert-manager for TLS certificate automation; OAuth/OIDC providers for authentication
Measuring DataOps Success
Quantifiable metrics help teams assess DataOps maturity and identify improvement areas:
- Deployment frequency: How often can you safely deploy changes to production? High-performing teams deploy multiple times per day. Track this metric per application and team.
- Lead time: Time from code commit to running in production. Shorter lead times enable faster iteration. Target: < 1 hour for non-stateful applications, < 4 hours for stateful applications requiring state migration.
- Mean time to recovery (MTTR): How quickly can you restore service after an incident? Automation and observability reduce MTTR. Target: < 15 minutes for automated rollbacks, < 1 hour for complex incidents.
- Change failure rate: Percentage of deployments causing incidents. Effective testing and gradual rollouts minimize failures. Target: < 5% for production deployments.
- Data quality metrics: Track schema validation failures, data completeness, and accuracy to ensure pipeline quality. Implement automated data quality testing and monitor quality SLOs.
- Pipeline availability: Percentage of time streaming pipelines are processing data within SLA. Target: 99.9% (43 minutes downtime/month) or better for critical pipelines.
- Developer satisfaction: Survey teams regularly to identify friction points in development and deployment workflows. High satisfaction correlates with productivity and retention.
Security and Compliance in DataOps
Integrating security into DataOps workflows ensures streaming systems meet compliance requirements without slowing development:
- Secrets management: Never commit credentials to version control. Use secret management tools (Vault, AWS Secrets Manager) integrated into CI/CD pipelines to inject secrets at runtime.
- Access control: Implement role-based access control and audit all administrative actions. Define who can deploy to production, modify topic configurations, or access sensitive data through policy-as-code.
- Encryption: Enforce TLS for data in transit and encryption at rest for state stores and logs. Automate certificate rotation to prevent expiration incidents.
- Compliance automation: Embed compliance checks into CI/CD pipelines. Validate data retention policies, PII handling, and geographic restrictions before deployment. Audit logging provides the trail necessary for compliance verification.
- Shift-left security: Catch security issues during development through automated scanning of container images, dependency vulnerability checks, and configuration validation.
Conclusion
DataOps practices provide the operational foundation for streaming architectures at scale. Automation, rigorous testing, safe deployment strategies, and comprehensive observability let teams deliver streaming systems that are both agile and reliable.
The investment pays off: faster delivery of new features, fewer production incidents, and teams that can change things without fear. With KRaft-based Kafka, OpenTelemetry, GitOps deployment patterns, and platforms like Conduktor, the tooling is mature. Start small — automate one pain point, add one test suite, improve one deployment process — and build from there.
Related Concepts
- CI/CD Best Practices for Streaming Applications - Deployment automation for streaming systems
- Infrastructure as Code for Kafka Deployments - Managing streaming infrastructure as code
- Data Quality Dimensions: Accuracy, Completeness, and Consistency - Quality frameworks for DataOps
Sources and References
- The DataOps Manifesto
- Accelerate: Building and Scaling High Performing Technology Organizations
- Apache Kafka Operations Guide
- Site Reliability Engineering: How Google Runs Production Systems
- OpenTelemetry Documentation
- DORA Metrics and DevOps Research
Written by Stéphane Derosiaux · Last updated April 29, 2026