Most organizations running Kafka in production have some version of disaster recovery in place. However, it's often limited to having a secondary cluster in another region, replication running, and a runbook documented somewhere. If someone asks at a planning meeting whether Kafka DR is covered, the answer is yes but that answer is usually incomplete.
It's incomplete because while replication gets the data to a secondary cluster, it doesn't get 50 services pointed at that cluster at 3 AM when half the team is asleep and nobody is sure who can authorize the change. The tasks invoved in assessing the failure and executing the DR runbook typically take 20-40 minutes, but that doesn't take into account the coordination needed: reaching people, getting approvals, sequencing deployments, and verifying each service actually switched. The coordination effort scales linearly with the number of critical applications you run on Kafka and that's where the hours go.
This guide covers six technical areas a DR strategy needs beyond data replication (security and identity parity, topic and schema configuration, data protection continuity, observability, client switching, and testing), organized across three operational phases. We spend a fair amount of time on chaos testing as a way to measure your actual recovery time rather than estimate it, partly because it works, and partly because DORA, SOC 2, PCI-DSS, and GDPR all now require measured evidence of recovery capability.
This ebook is designed for platform engineers, SREs, and infrastructure architects who own Kafka in production and want to improve their kafka disaster recovery process. If you want to skip ahead to a quick assessment, the DR Readiness Self-Assessment at the end works as a standalone gap analysis.
If you run Kafka in production, you probably have some version of disaster recovery in place. Two clusters in different regions, MirrorMaker 2 or Confluent Cluster Linking replicating topics and consumer offsets. Maybe a runbook in Confluence, last updated sometime before the person who wrote it changed teams. The secondary cluster has the data and the replication lag is acceptable, so if someone asked you at a planning meeting whether Kafka DR was covered, you would say yes.
Copying data to a secondary cluster is necessary but nowhere near sufficient. As one platform architect put it after watching a failover drill go sideways: "Just copying data is useless if your clients can't access the data." The secondary cluster can have a perfect replica of every topic, every consumer offset, every schema, and none of that matters if your 47 services are still pointing at the dead primary and switching them requires a Slack message that starts with "Can everyone please update their bootstrap servers."
Data availability is the solved part. Coordination is where failovers actually break down.
Anatomy of a real outage
On August 28, 2025, PagerDuty's Kafka cluster failed. The incident management platform that thousands of companies rely on to tell them when things break could not tell anyone that it was broken.
The root cause was a code pattern that created a new KafkaProducer instance for every API request instead of reusing a shared one. At scale, this generated 4.2 million producer instances per hour. Each instance allocated buffer memory, opened broker connections, and registered for metadata tracking. The brokers drowned in overhead, JVM garbage collection spiraled, and the cluster collapsed. At peak, 95% of events were rejected, and the outage lasted over nine hours.
PagerDuty runs one of the most critical notification systems on the internet and despite their best efforts and skilled engineers, they still had a major incident. Even organizations with functional replication, correct configurations, and a healthy secondary cluster experience prolonged outages, because the human and organizational response cannot keep pace with the failure.
The timeline of a Kafka outage follows a painfully predictable pattern. The specifics change, but the shape stays the same.
T+0 — Monitoring fires Assuming your monitoring does not depend on the infrastructure that just failed. PagerDuty's own status page updates were delayed during their outage because their alerting automation also relied on the broken Kafka cluster. This is more common than anyone admits.
T+5 min — Check Slack Three people are awake, and none of them wrote the runbook.
T+15 min — Read the runbook It says "switch traffic to the secondary cluster." But you have 47 services, each with bootstrap servers configured in environment variables, Kubernetes secrets, or config files scattered across five repositories. "Switch traffic" is dozens of actions owned by different teams and deployed through different pipelines.
T+30 min — Find the approver The person who normally approves production changes is on vacation, and their backup is in a different time zone, asleep. Even when you reach the right person, they need context on the failure scope before they will authorize a failover, rightly so, because a premature failover can itself cause data loss.
T+60 min — Coordinate deployments Deploy pipelines are slow and some services are owned by teams that will not be awake until morning. A few critical services turn out to have hardcoded bootstrap servers outside any config management system. The developer who wrote that code left six months ago.
T+90 min — Discover credential mismatch Credentials on the secondary cluster do not match the primary. Three services authenticate successfully but cannot write to the topics they need because ACLs were never synced.
T+180 min — Finally recovered Configs pushed, services restarted, things working. Your "5-minute RTO" was actually 180 minutes, and that is assuming nothing else went wrong.
The timeline above is not the failure by specific teams or people, but the predictable outcome of a specific structural problem: recovery time scales linearly with the number of critical applications, not with infrastructure quality.
The infrastructure work is typically a fixed-cost effort regardless of the infrastructure. Assessing the failure scope (single broker, partial failure, or full regional outage?) takes 5-15 minutes and executing the DR runbook (stopping replication, converting mirror topics, and verifying data integrity) takes another 15-25 minutes. That adds up to 20-40 minutes regardless of whether you have 5 critical applications or 50.
The part that scales linearly is per-project coordination. For each critical application, the platform team needs to assess business impact, brief leadership, reach the on-call engineer, wait for acknowledgment, coordinate deployment sequencing (producers before consumers, dependency chains), then verify each application actually switched and is processing correctly. In practice, that runs 15-45 minutes per critical project.
This is also a best case scenario because it assumes things go smoothly. Issues such as credential mismatches between clusters add investigation time; connection pool issues in Java services require restarts that were not in the plan. DNS-based failover, which seems like it should help, runs into a fundamental problem: Kafka clients cache broker connections and do not re-resolve DNS on existing sessions and the JVM caches DNS aggressively by default. This might mean that when you change the DNS record, half your services are still talking to the dead cluster.
The infrastructure switch takes seconds, but everything around it takes hours and the driving factor is the size and complexity of your organization, not the quality of your technology.
As one DR consultant who has worked through dozens of these incidents put it: "It's not really a technical problem. It's an organizational problem."
Technical teams measure outages in RTO and RPO, but the rest of the organization measures them in terms of business image.
$1.25M lost in a 3-hour outage for a mid-size e-commerce company processing $10M/day. Organizations with 15-20 critical Kafka services face $150K-$500K/hour total exposure.
Trust takes years to build and hours to destroy. Your next outage is your competitor's sales opportunity. How many customers start evaluating alternatives the same week?
DORA, SOC 2, PCI-DSS, and GDPR all require tested recovery capability. "We have a plan but haven't tested it" is a finding. A 3-hour recovery against a 15-minute target is also a finding.
Repeated 3 AM pages burn out the engineers you need most. The people who can fix it under pressure are the same people who get paged every time. DR that depends on heroics is a retention risk.
Revenue. A mid-size e-commerce company processing $10M per day loses roughly $1.25M in a 3-hour outage, before accounting for abandoned carts that never come back. For financial services, three hours of blocked transactions means regulatory gaps and customers who move their money elsewhere. The impact also multiplies across services, because when infrastructure fails it takes down every application that depends on it, not just one. Organizations with 15-20 critical Kafka-dependent services face exposure in the range of $150K-$500K per hour of total outage, depending on how many of those services are customer-facing.
Calculate your DR exposure
A rough calculation: take your number of critical Kafka-dependent projects, multiply by the estimated hourly business impact per project ($3K-$10K for internal systems, $10K-$25K for production and SLA-bound services, $25K-$100K for revenue-critical systems), and multiply by your honest estimate of recovery time in hours. That is your total exposure per incident.
Now multiply by the probability of a major incident in any given year. Most organizations estimate 10-25%. That is your annualized DR risk, and the baseline for any investment conversation.
Trust. PagerDuty published a transparent postmortem after their August 2025 incident, which was the right call, but how many of their customers started evaluating alternatives that week? Trust takes years to build and hours to destroy.
Compliance. Regulatory frameworks have moved beyond "do you have a plan?" to "show me when you last tested it." DORA mandates periodically tested ICT continuity plans. SOC 2 Type II requires recovery infrastructure to be maintained and tested, with effectiveness assessed over time. PCI-DSS requires incident response plans to be tested at least annually. GDPR requires regularly testing the effectiveness of security measures. If your answer to an auditor is "we have a plan but have not tested it," that is a finding. If you tested it and it took three hours against a 15-minute target, that is also a finding.
Human cost. Repeated 3 AM incidents burn out the engineers you need most, because the people who understand the system well enough to fix it under pressure are the same people who get paged every time. As one platform engineering lead observed: "Do we really want to page all our engineers at 3 AM repeatedly? They're just going to burn out." Disaster recovery that depends on heroics is a retention risk, not a strategy.
Kafka disaster recovery is almost a victim of Kafka's own success and stability. The clusters run so reliably that the insurance policy rarely gets tested, like health insurance when you are healthy: easy to undervalue, impossible to replace when you finally need it. The difference is that when Kafka disaster recovery fails, the cost is organizational, financial, regulatory, and reputational all at once.
Key points
- The gap is coordination, not replication. The infrastructure switch takes seconds. Reaching people, getting approvals, updating dozens of services, and discovering credential mismatches at 3 AM is what takes hours.
- Recovery time scales with project count. Infrastructure work is a fixed 20-40 minutes. Per-project coordination adds 15-45 minutes each. At 20 critical projects, coordination alone exceeds 10 hours.
- The PagerDuty incident is the pattern. Even well-resourced teams with functional replication experience prolonged outages when the organizational response cannot keep pace.
- Business impact compounds across four dimensions: revenue ($150K-$500K/hour for organizations with 15-20 critical services), customer trust, compliance exposure (DORA, SOC 2, PCI-DSS, GDPR all require tested recovery), and engineer burnout from repeated 3 AM incidents.
Disaster recovery is a discipline with three distinct phases, each requiring different work.
- Define RTO/RPO per workload
- Choose an active-passive or active-active replication strategy
- Set up cross-cluster replication
- Map dependencies
- Identify Wave 1 applications
- Run chaos tests
- Test monitoring and decision chain
- Pre-stage DR configurations
- Measure actual RTO
- Switch clients via stable endpoint
- Enforce security during cutover
- Validate Wave 1 first
- Communicate to stakeholders
Defining your Wave 1
Which services must recover first?
- Revenue-critical services: payments, checkout, pricing, order processing.
- Authentication and authorization: if users cannot log in, nothing else matters..
- Critical ETL and data pipelines: downstream systems that break without upstream data..
- Regulatory: audit logging, compliance reporting, transaction recording.
If Wave 1 services recover in minutes, you have bought yourself time for everything else, so keep the Wave 1 list short and explicit. A good rule of thumb is if it has more than a dozen services on it, you have not prioritized enough.
Be sure to evaluate what your critical services depend on and include them in your Wave 1. For example, a payment service that depends on a master data service means both are Wave 1.
Test Wave 1 recovery in every drill since Wave 1 recovery time is the number your auditor will ask for.
The six technical areas below are the specific things your DR design review should check to ensure you're fully prepared. Most organizations will have invested heavily in one or two, but the ones that recover in minutes have addressed all six.
Area 1: Security and identity parity
Teams reliably replicate data but forget the security posture around it. Auth credentials are often cluster-specific and ACLs may exist on the primary but were never provisioned on the DR cluster. During failover, applications authenticate but cannot authorize or get broader access than intended, creating compliance exposure at the worst possible moment.
What to check:
- Are TLS certificates and custom CAs deployed to both clusters?
- Do all authentication methods (mTLS, SASL, OAuth) work on the secondary?
- Are ACLs and RBAC rules synced automatically, or do they require a manual step that someone could miss?
- Are cluster-specific credentials (e.g., Confluent Cloud API keys are tied to individual clusters) provisioned for both?
- Are audit logs available from the secondary cluster for post-failover compliance review?
If clients authenticate directly to Kafka, every client needs credentials for both clusters. A proxy layer that decouples client identity from cluster credentials means only the proxy needs dual-cluster access, a simplification that pays off well beyond DR.
What we have seen: A platform team discovered during their first DR drill that ACLs on their secondary cluster were six months stale. Three services authenticated successfully but could not write to the topics they needed. The root cause was a missing step in their infrastructure-as-code pipeline that synced ACLs to the primary but not the secondary.
Area 2: Topic and schema configuration parity
Replication tools move data, not configuration, so topic-level settings tend to drift between clusters over time. Additionally, the schema registry is often a separate system entirely and schemas may not be replicated or compatibility rules may differ. That means that after a failover, consumers can fail on schema mismatches, topics might compact unexpectedly, or quotas may throttle catch-up traffic right when you need maximum throughput.
Common sources of configuration drift:
- Retention policies or compaction settings changed on primary but not mirrored
- Dead letter topics that exist on primary but were never created on the secondary
- Quotas tuned for production traffic on primary, left at defaults on standby
- Schema Registry compatibility rules that differ between clusters, letting the wrong schema version through
- Topic-level overrides (e.g.,
max.message.bytes, segment.ms) applied ad hoc and never documented
This kind of drift is very difficult to audit and track, so often they only surface under pressure.
Area 3: Data protection and compliance continuity
Encryption and masking policies are often applied at the application or infrastructure layer rather than within Kafka itself. When clients fail over to a different cluster or region, those policies do not automatically follow, especially if they are enforced by infrastructure co-located with the failed primary.
This creates several risks that compound during failover:
- Field-level encryption keys may be stored in a regional KMS or Vault instance that the secondary cluster cannot reach, causing consumers to receive encrypted payloads they cannot decrypt
- Dynamic masking rules enforced on the primary side may not be replicated, exposing raw PII to consumers that normally only see masked data
- Data residency requirements may restrict certain topics to specific regions. Failing over those topics to a cluster in a different jurisdiction creates a compliance violation, not just a technical issue
- Audit trail continuity breaks if the logging infrastructure that records who accessed what data is tied to the primary cluster's region or network
Verify that every data protection policy applied in your primary region has an equivalent enforcement mechanism in your DR region and test that enforcement during drills.
Area 4: Observability and operational readiness
Monitoring is often configured per-cluster, so if your dashboards, alerts, and on-call routing depend on the same infrastructure that failed, you are flying blind during failover. Separately, teams rarely plan for the burst of catch-up traffic that hits the secondary after the switch, which can cause cascading failures on what was supposed to be the rescue.
Three things to verify:
1. Monitoring independence. Does your Kafka metrics pipeline (JMX exporters, Prometheus scraping, Grafana dashboards) survive the failure it is supposed to detect? If it runs on the same cluster or network path as production traffic, you lose visibility exactly when you need it most.
2. Capacity headroom. Plan secondary cluster capacity for at least 1.5x normal load to absorb the reconnection burst. Every client reconnecting simultaneously generates a spike that can overwhelm a standby cluster provisioned for steady-state traffic.
3. Producer timeout alignment. Most teams estimate their Recovery Point Objective (RPO), the maximum amount of data they can afford to lose, by looking at cross-cluster replication lag. If the secondary is 30 seconds behind the primary, they assume 30 seconds of data loss in a failover. But replication lag only accounts for data that made it to the primary in the first place. Producers buffer unsent records in memory, and when brokers go down, that buffer fills up and eventually both blocked and buffered records fail with timeout exceptions. The default delivery.timeout.ms is two minutes, meaning producers will silently discard data after two minutes of broker unavailability. If your detection-and-decision window is longer than that (and for most organizations, it is) you are losing data on the producer side before anyone has even decided to fail over. Review your producer timeout settings: if delivery.timeout.ms is shorter than your expected detection-plus-decision window, your actual data loss window is wider than your replication lag suggests.
What we have seen: A team's delivery.timeout.ms was set to the default two minutes, but their detection-and-decision window averaged eight minutes. During their first chaos experiment, they discovered that producers had been silently discarding data for six minutes before anyone decided to fail over. Their actual data loss was 4x greater than their replication lag alone would have predicted.
Area 5: Client switching and traffic routing
There is no mechanism built into Kafka to redirect running clients during failover. Every workaround, whether centralized Kubernetes operators, DNS-based service discovery, or custom wrapper code, either requires centralized control of all clients (which most organizations do not have at scale) or bespoke code in every application.
Why common approaches fall short:
- Per-service config updates require touching environment variables, K8s secrets, or config files across many repositories and deploy pipelines. This is the approach described in most runbooks, and it is why recovery takes hours.
- DNS-based failover seems like it should work, but Kafka clients cache broker connections and do not re-resolve DNS on existing sessions. The JVM caches DNS aggressively by default, leading to an situation where you change the record but half your services keep talking to the dead cluster.
- Client-side rebootstrap (KIP-899, Kafka 3.8+) is an opt-in feature that lets clients fall back to bootstrap servers when all discovered brokers fail. Older clients cannot do this and require restarts. Factor your client version distribution into your RTO estimates.
What good looks like: a stable endpoint that clients connect to once, with cluster switching handled behind it, so that failover becomes a single operational decision rather than a per-service coordination exercise.
What we have seen: A logistics company attempted DNS-based failover across 40 services. After updating the DNS record, 60% of services picked up the change within 10 minutes. The remaining 40% (mostly Java services with aggressive JVM DNS caching) stayed connected to the dead cluster for over an hour. The platform team spent more time debugging DNS propagation than they would have spent on manual config updates.
Area 6: Testing and continuous validation
The most commonly skipped step, because it is disruptive, expensive, and politically difficult. Under the traditional model, each team participating in a full DR test spends 4-8 hours on pre-test coordination meetings, configuration changes, test execution, verification, and the retrospective. The platform team spends 1-3 hours coordinating each team's participation. At 20 critical projects, a single test costs 100-200+ person-hours, which is why most organizations test annually at best.
What annual-or-never testing actually means:
- Configuration drift accumulates unchecked for 12+ months between tests
- Runbooks decay as team structures, tooling, and approval chains change
- New services get added to Kafka without being added to the DR plan
- The first real test happens during the actual disaster
Injecting failures at the proxy layer (simulating broker errors, auth failures, latency) without touching production Kafka lowers the barrier significantly. Per-team test participation can drop from hours to under an hour, and teams can pre-validate application resilience through chaos testing in lower environments so that the live DR test becomes a confirmation rather than a discovery exercise. Organizations using this approach move from annual to quarterly testing while spending less total time.
Multi-region Kafka falls into two patterns, each with different tradeoffs. This is a per-workload decision, not a global one. For a deeper technical treatment, see Multi-Region Kafka: Active-Active vs Active-Passive.
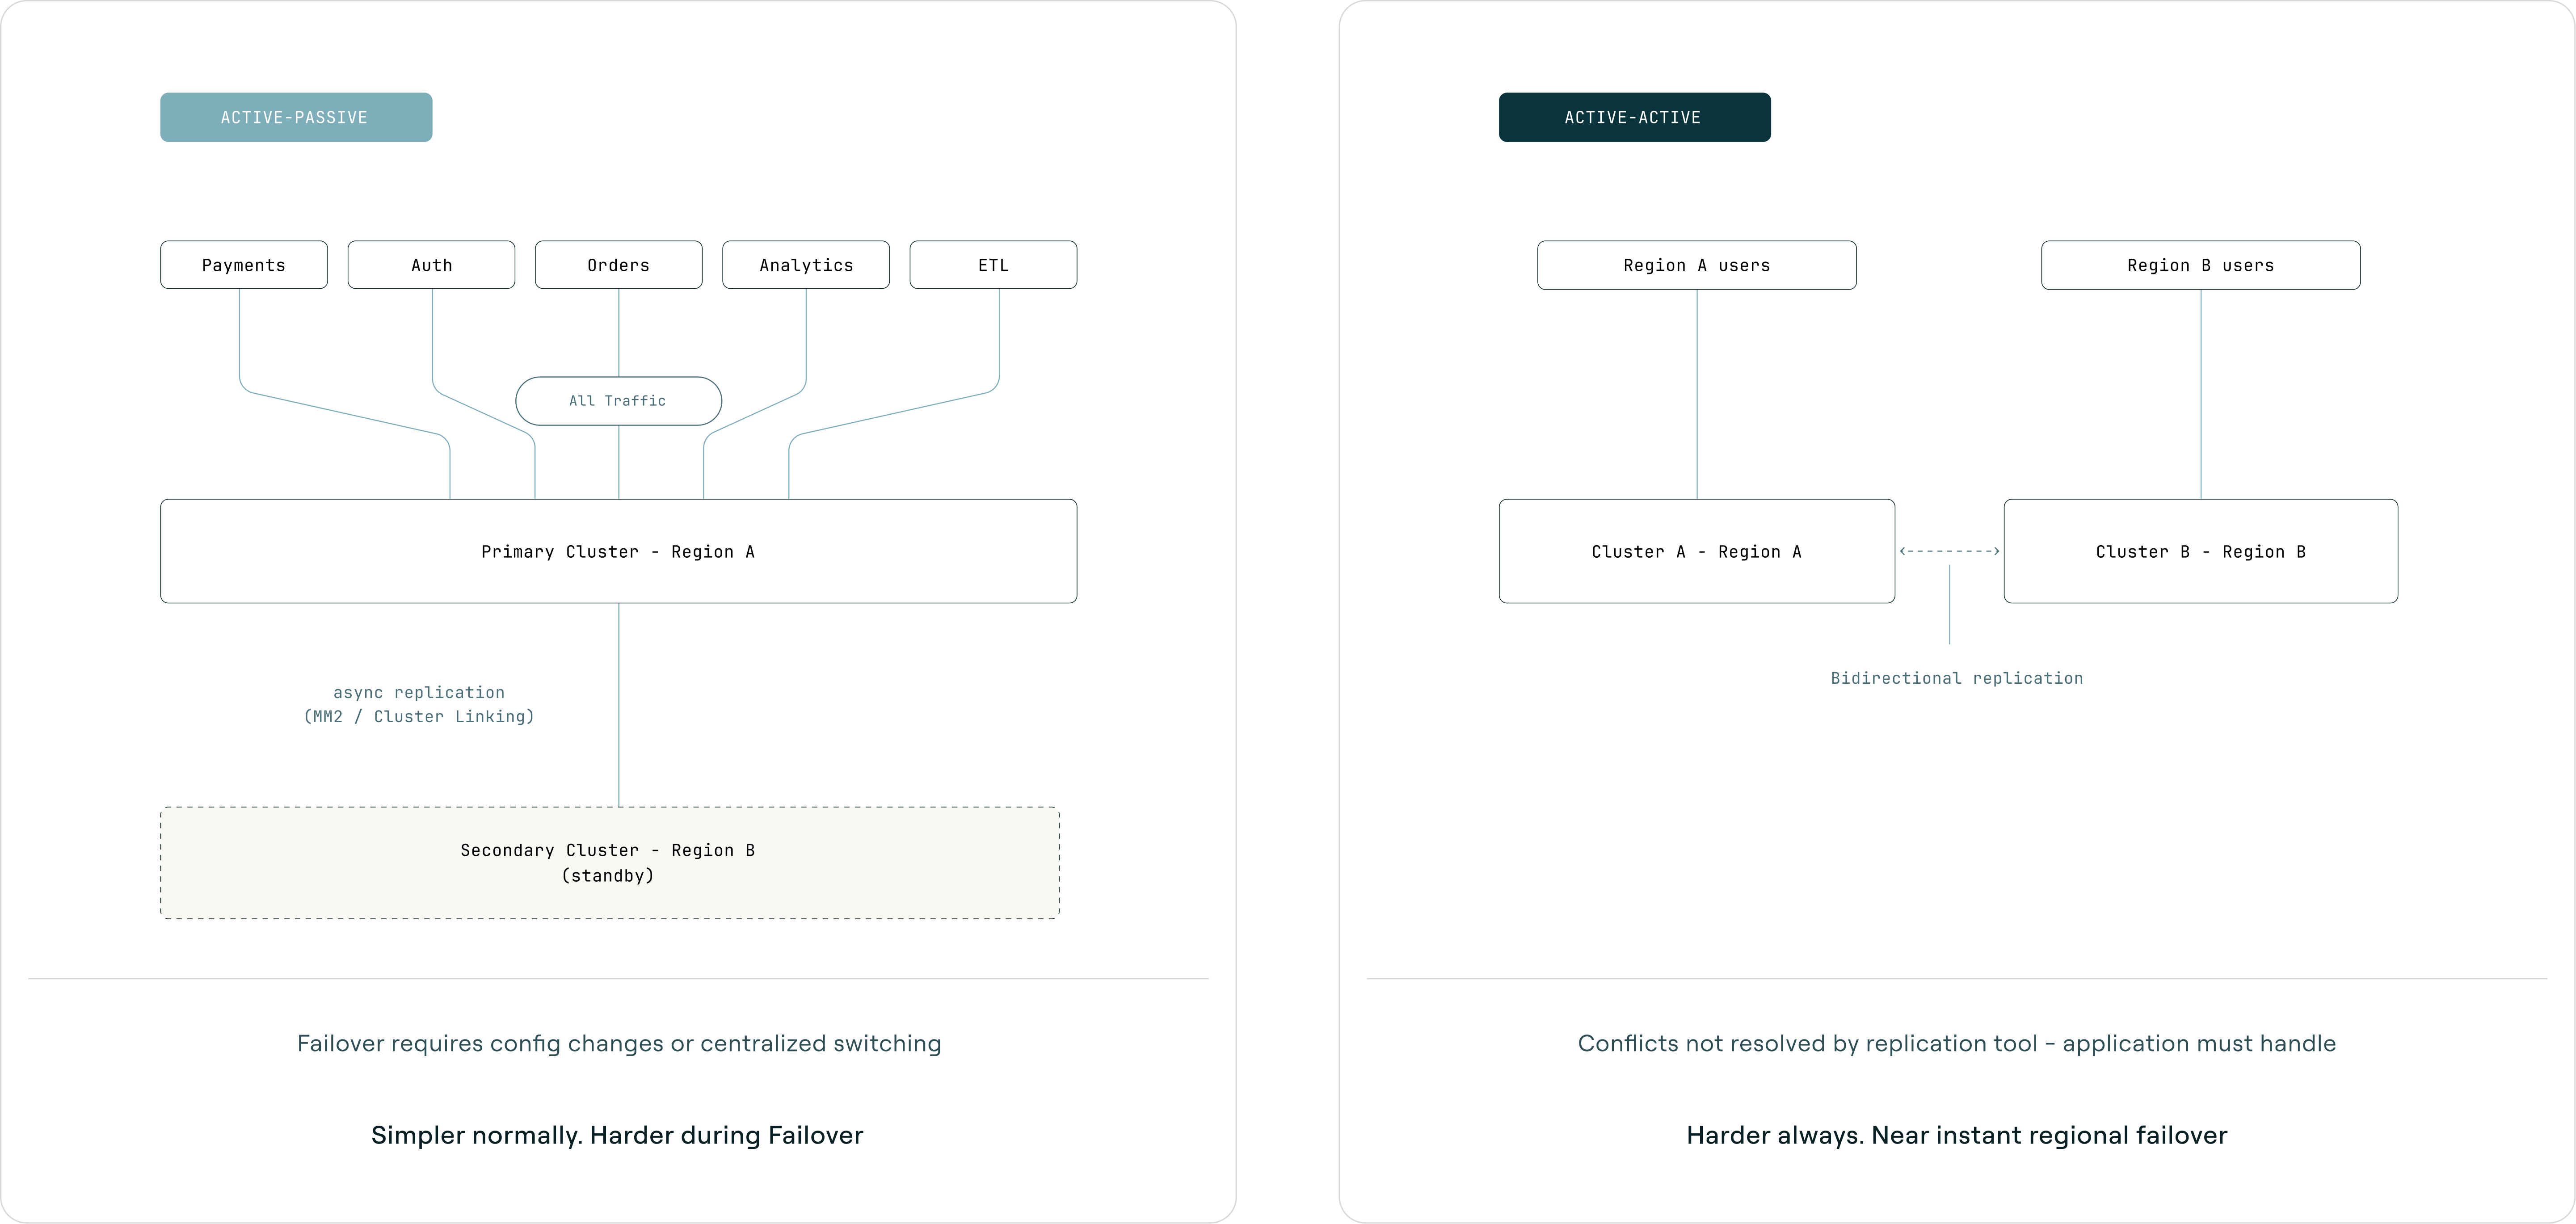
Active-passive runs one primary cluster that handles all production traffic while a secondary cluster receives replicated data and waits. When the primary fails, you switch traffic to the secondary and consumers resume from replicated offsets. Simpler during normal operations, but harder during failover because switching requires config changes across all services (unless centralized behind a proxy). Best when the application cannot handle conflicts, a single source of truth is required, or the team lacks operational maturity for active-active.
Active-active runs both clusters simultaneously, with regional producers writing to their local cluster and MirrorMaker replicating bidirectionally. Both clusters have local topics and replicated topics from the other region. Failover for regional traffic is near-instant since it is already flowing, but complexity is higher at all times. Best when users are geographically distributed, data can partition by region or entity, and the application is designed for eventual consistency.
A key consideration: MirrorMaker 2 offset sync lags by the checkpoint interval (default 60 seconds), so after failover, consumers may reprocess up to 60 seconds of messages. Active-active also introduces write conflicts that MirrorMaker does not resolve; the application must handle this through regional authority, last-writer-wins, or idempotent event design.
| Aspect | Active-passive | Active-active |
|---|
| Recovery Point Objective (RPO) | Replication lag (seconds to minutes) | Near-zero for regional data |
| Recovery Time Objective (RTO) | Minutes to hours (depends on switching mechanism) | Seconds (traffic already flows) |
| Complexity | Lower normally, higher during failover | Higher always |
| Consistency | Strong (single source of truth) | Eventual (conflicts possible) |
For most organizations starting their DR journey, active-passive with centralized switching is the right starting point. It provides strong consistency guarantees and is operationally simpler to reason about. Active-active makes sense when you have users distributed across regions and can design your data model around regional partitioning.
If preparation and validation are done well, actual failover should be a calm, sequenced procedure rather than an improvisation. This page should be simple enough that the person on call at 3 AM can execute it without the person who designed it.
- Confirm incident scope
- Single broker, partial, or full outage?
- Approve cutover
- Keep approval chain short
- Route via stable endpoint
- One action, not dozens
- Wave 1 apps first
- Don't wait for 100%
- Monitor and adjust
- Communicate status
Planned vs. unplanned failover: For planned failovers (DR drills), you can pause producers, wait for replication to catch up, execute the switch, and resume. For unplanned failovers (the primary is dead), you verify secondary health, check replication lag (this is your data loss window), and execute the switch. There is no "migrate consumers first" because the primary is already gone. Accept the replication lag as data loss and cut over.
Failback. Switching back to the original primary after the incident resolves is often harder than the initial failover, and most teams do not plan for it until they need it. Re-establishing replication in the reverse direction takes time and verification. Data written to the secondary during the incident needs to be reconciled (which cluster is now authoritative?). The secondary may be running at reduced capacity if it was provisioned as a standby rather than a full peer, and a rushed failback under pressure introduces the same coordination risks you just experienced during failover. Failback deserves its own tested runbook. If you have never practiced it, treat it as a separate project.
Reserve human judgment for the decision to fail over, then let tooling handle the act of failing over. Systems do not stress at 3 AM, forget steps, or need approval chains.
Key points
- Three phases: Prepare, Validate, Execute. Replication covers roughly one-third of the work. The other two-thirds is security parity, config sync, observability, client switching, and testing.
- Six areas to verify. Security and identity, topic and schema config, data protection, observability, client switching, and testing. Most teams have addressed one or two. Recovery in minutes requires all six.
- Wave 1 drives your RTO. Keep it short (under a dozen services), verify dependencies between Wave 1 services, and test Wave 1 recovery in every drill.
- Active-passive is the right starting point for most organizations. Active-active makes sense when users are geographically distributed and the data model supports regional partitioning.
- The failover runbook should fit on one page. Detect, Decide, Switch, Validate, Stabilize. Reserve human judgment for the decision; let tooling handle execution.
An untested disaster recovery plan is a set of assumptions about how your system, your organization, and your people will behave under conditions none of them have experienced. Each untested assumption multiplies recovery time, and the gap between what your plan says and what actually happens is invisible until something breaks for real.
Configuration drift is silent. Topic configs, ACLs, schemas, and quotas drift between primary and secondary clusters over weeks and months. Nobody introduces the drift deliberately, it just accumulates through routine changes that get applied to the primary but not the secondary. Without testing, you discover the drift during the real failover, alongside everything else going wrong.
Runbooks decay. Written by someone who left six months ago, reviewed by nobody since. A runbook that assumes a toolchain, team structure, or approval chain that no longer exists gives the team false confidence they're prepared for how to respond to incidents.
Compounding assumptions. Teams assume producer retry logic works under real broker failure conditions, that consumer group rebalancing completes within the RTO window, that monitoring fires when the infrastructure it monitors is the thing that just failed. Each assumption is reasonable in isolation but together, they create an RTO gap that only surfaces under pressure.
The "green dashboard" trap. Everything on your monitoring dashboard can be green while your DR plan is broken. Monitoring shows averages over minutes or hours, but DR failures happen in the 30-120 seconds between a broker going down and consumer groups stabilizing. That transient window is where data loss, duplicate processing, and cascading failures occur and most monitoring tools sample too infrequently to catch any of it.
If your RTO target is 15 minutes but your drill takes 90, that is a major gap, not a minor disagreement. The only way to discover it before a real incident is to test.
The economics of not testing. DR testing is expensive under the traditional model. Each team participating in a full DR test spends 4-8 hours on pre-test coordination meetings, configuration updates, test execution, verification, and retrospectives. The platform team spends 1-3 hours coordinating each team's participation. At 20 critical projects, a single test costs 100-200+ person-hours before accounting for management and SRE involvement. Multiply by the coordination overhead (management attention, cross-team synchronization, schedule disruption) and the true cost is higher still. This is why most organizations test annually at best, or not at all, and why the first real test often happens during the actual disaster.
Chaos engineering means deliberately injecting controlled failures to discover how your system actually behaves, rather than how you think it behaves. State what you expect, inject the failure, observe what happens, document the delta.

Kafka makes this harder than stateless services. A web service either returns a 200 or a 500, but a Kafka consumer might silently fall behind, double-process messages, or get stuck in an infinite rebalance loop without producing an immediate, obvious error. Stateful partitions, consumer group coordination, and offset management create failure modes that do not exist in request/response systems.
The failure modes that matter for DR go beyond broker availability. Partial infrastructure outages trigger leader elections where producers and consumers see transient errors, and applications that do not retry correctly lose messages or stall. Consumer crashes and rebalances cause duplicate message processing; if the consumer logic is not idempotent, the consequences are concrete: duplicate payments, incorrect stock levels, double-counted orders. Slow brokers during garbage collection or disk contention introduce latency that breaks stream processing joins silently, and invalid schema changes during registry failover stop consumers entirely.
These are common Kafka behaviors that most applications have never been tested against.
Traditional chaos tools make this difficult. Killing broker pods, partitioning networks, or running destructive scripts on hosts requires infrastructure access, risks real data loss, and is hard to scope to a single workload. For DR validation the goal is to exercise application behavior under Kafka failure modes, not to prove that the operator correctly terminates a pod.
A protocol-aware Kafka proxy changes the shape of the problem. The proxy sits between clients and brokers, intercepts Kafka wire-protocol requests, and fabricates broker responses at the protocol layer: error codes, response delays, duplicated records, corrupted payloads, invalid schema IDs. Brokers stay untouched. Experiments scope to a single virtual cluster, topic, or consumer group, so you can target one workload without affecting the rest of the estate.
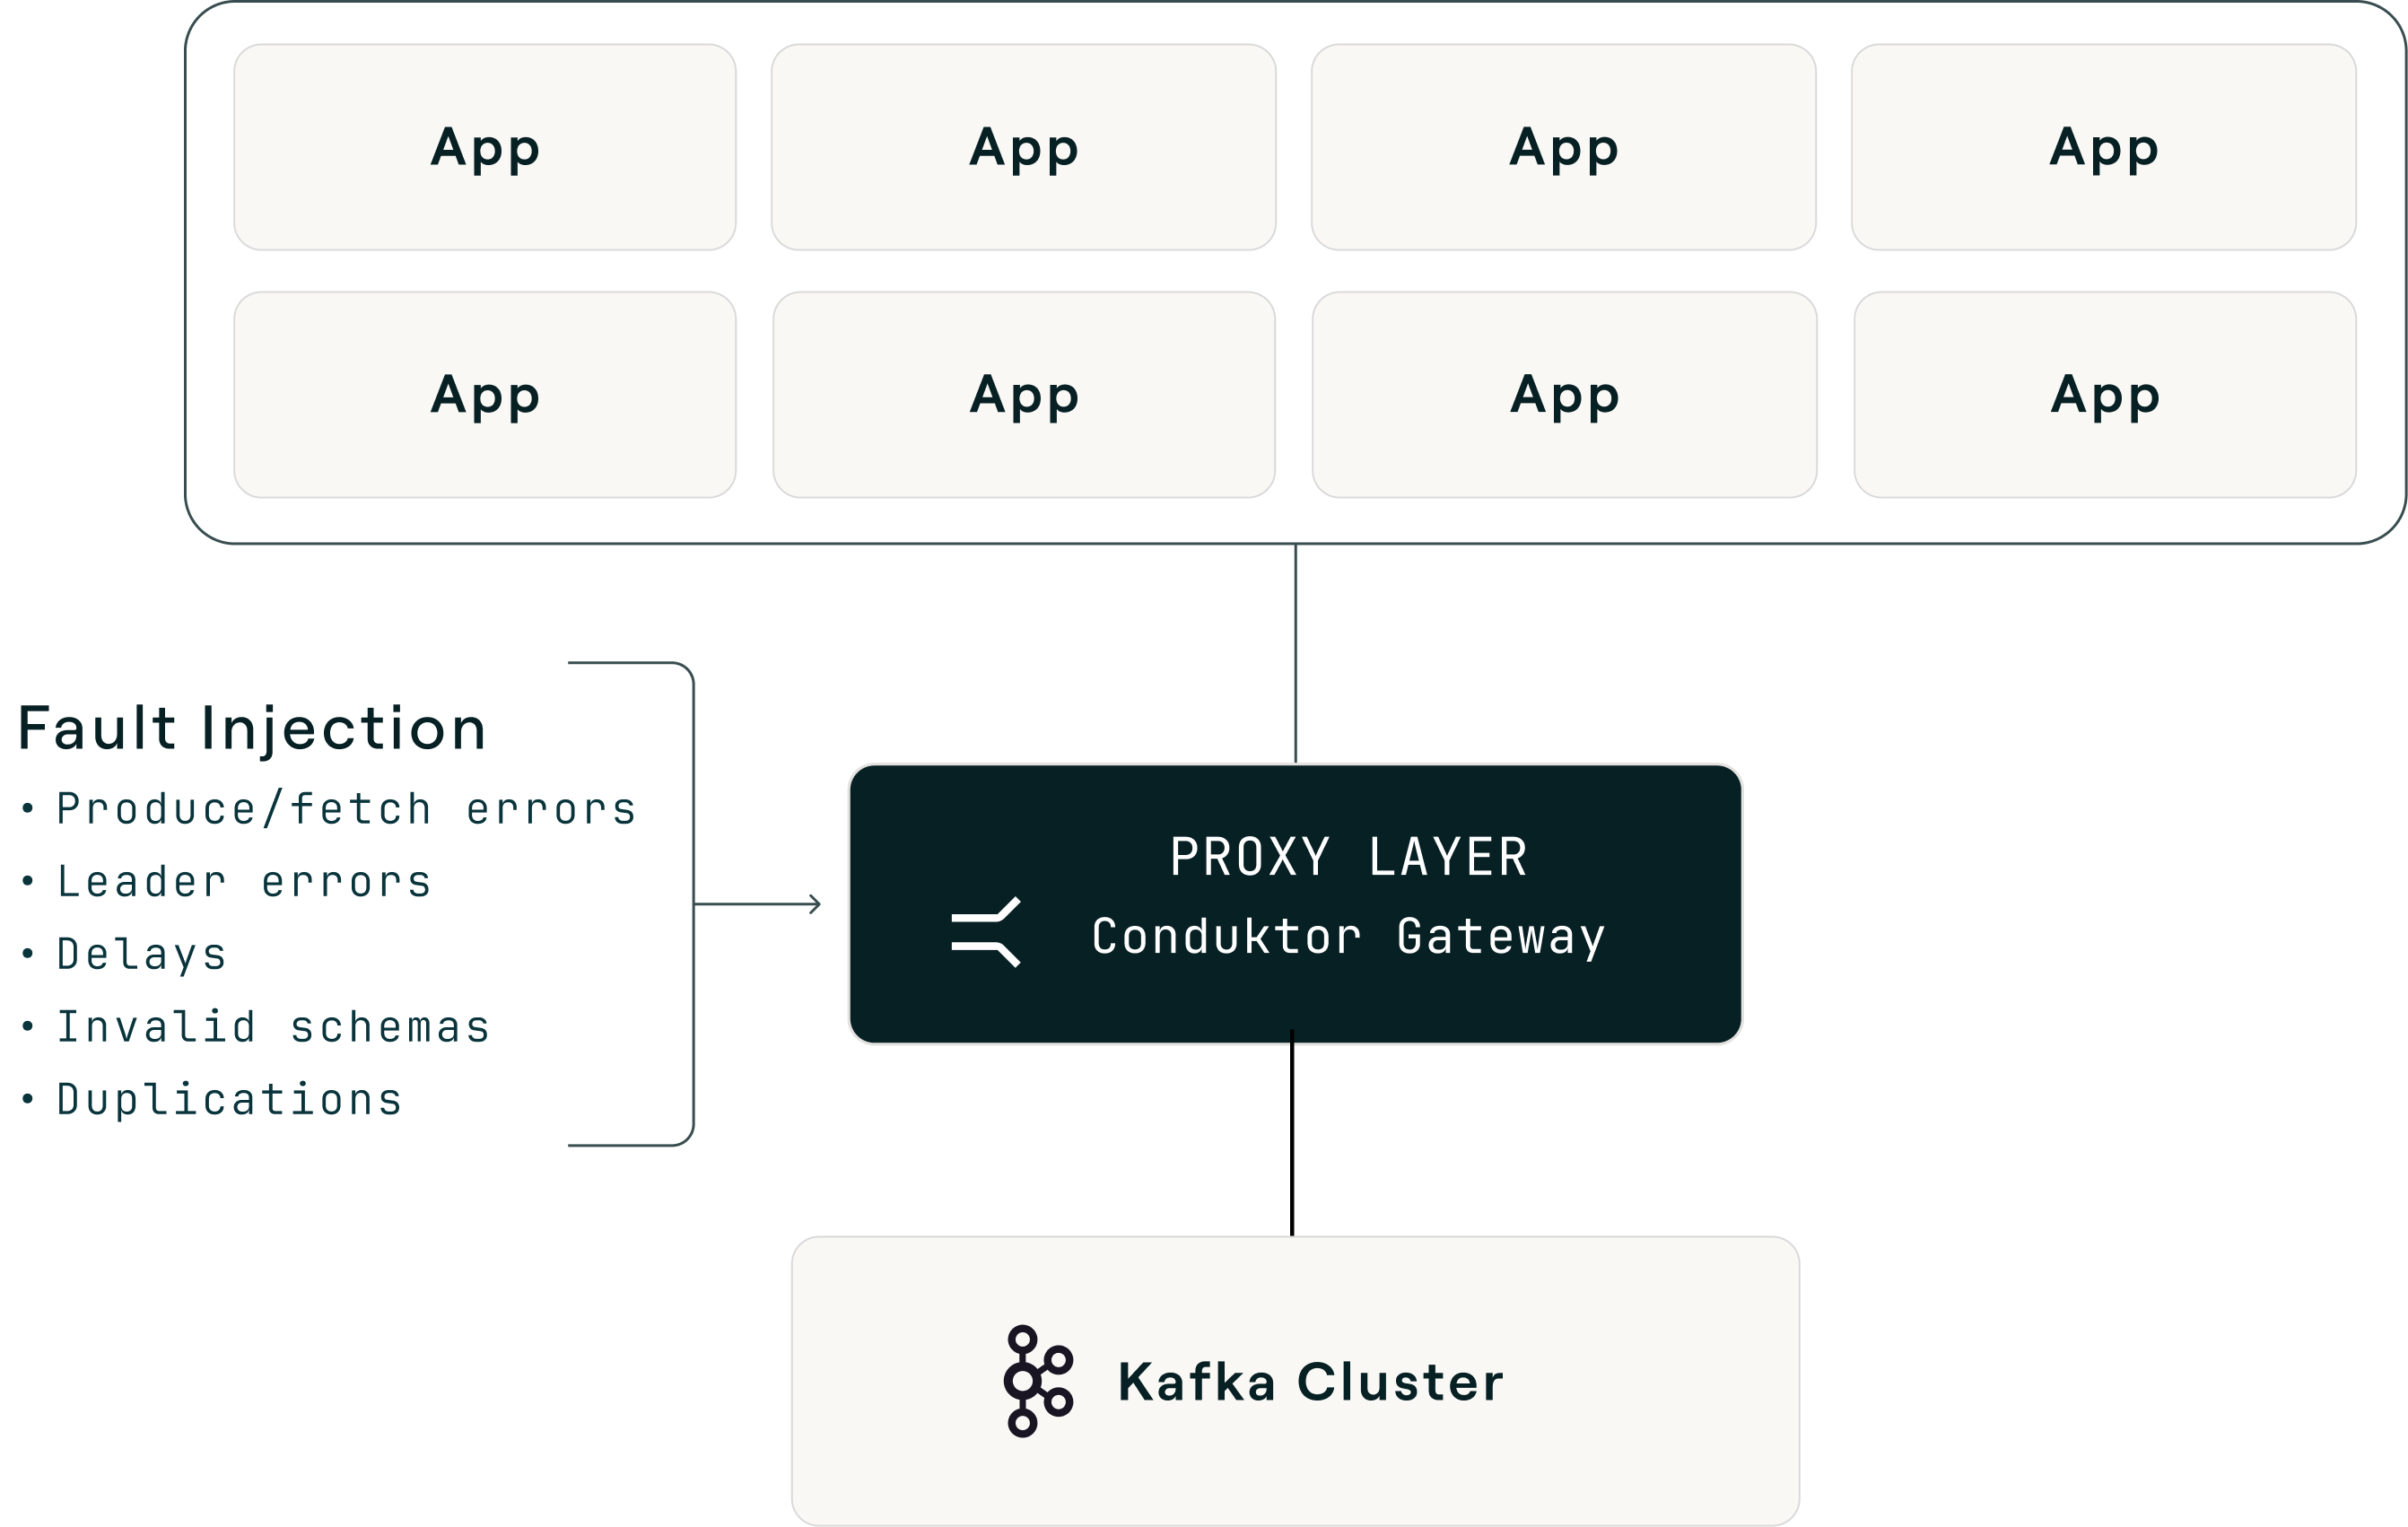
The practical result is that each scenario in the next section maps to a pre-built interceptor: broken brokers, leader election errors, latency, slow brokers, slow producers and consumers, invalid schema IDs, message corruption, and duplicate messages. Failure type, rate, scope, and duration are declarative configuration rather than code, which turns chaos testing from a quarterly special project into a routine activity. No other Kafka proxy on the market ships this breadth of pre-built chaos interceptors, which is the reason Conduktor Gateway stands out as the tool of choice for Kafka chaos testing.
| Scenario | What to inject | What it reveals | Common first finding |
|---|
| Broker unavailability | Produce/fetch errors at 10-25% | Whether clients reconnect cleanly or get stuck | Retry storms from aggressive configs |
| Leader election storms | Leader errors at 30% | Whether alerting distinguishes brief elections from sustained crises | Rebalance takes 2-5x longer than expected |
| Latency spikes | 500ms-2s delays at 50% | Whether timeout configs match RTO expectations | delivery.timeout.ms set lower than detection time |
| Schema registry failures | Invalid schema IDs on fetch | Whether consumers degrade gracefully or crash | No fallback when registry is unreachable |
| Duplicate messages | Duplicated delivery | Whether deduplication and idempotency actually work | Payments double-charged, events counted twice |
Your first experiment. Start with broker unavailability at 10% on a non-critical topic in staging. Define your hypothesis: "If 10% of produce requests return errors, our producer retries successfully and no messages are lost." Set abort criteria before starting (consumer lag exceeding 5 minutes or producer error rate exceeding 50% means you stop immediately). Run for 15-30 minutes and document what you expected versus what happened.
Then graduate: increase the failure rate, move to a more critical topic, try it in pre-production, and eventually run it as a game day with the full on-call team participating.
Time investment for the first experiment: about 2 hours for setup, execution, and documentation. Compare that to the hours you will spend during an unvalidated failover.
Chaos testing is not just an engineering exercise. A single well-documented experiment produces the five artifacts auditors care about: a timestamped test execution record, measured recovery metrics, a gap analysis (expected versus observed), a remediation record, and re-test confirmation.
Most teams treat compliance testing and resilience testing as separate workstreams with separate schedules, documentation, and stakeholders, when they are the same workstream. Document your chaos experiments properly and your next audit preparation is already done.
| Framework | What it requires for DR | Recommended testing cadence |
|---|
| DORA | Periodically tested ICT continuity plans, at least yearly plus after substantive changes | Quarterly experiments + annual game day |
| SOC 2 Type II | Recovery infrastructure maintained and tested; effectiveness assessed over time | Quarterly (showing pattern, not just one test) |
| PCI-DSS | Incident response plan tested at least annually | Annual minimum; isolate payment pipeline specifically |
| GDPR | Regularly testing effectiveness of security measures | On infrastructure change + quarterly |
The common thread: every framework requires tested and documented recovery capability, not just planned capability. The distinction matters at audit time. For an example in production, see how Bitvavo built DORA and MiCA compliance evidence from their Kafka operations.
The 15-minute experiment report
Document each chaos experiment with six fields. This template produces audit-ready evidence and engineering insights from the same activity with minimal effort and maximum utility.
| Field | What to write |
|---|
| 1. Hypothesis | "If we inject X failure at Y% rate, we expect Z behavior." |
| 2. Test configuration | What was injected, at what rate, scoped to which topics/services, for how long. |
| 3. Observed behavior | What actually happened. Consumer lag, error rates, rebalance timing, message counts. |
| 4. Delta from expected | Where observed behavior diverged from the hypothesis. |
| 5. Remediation | What configuration, code, or process changes were made as a result. |
| 6. Re-test results | Evidence that the fix worked. |
The most important thing to test is the gap between "alert fires" and "someone calls the failover API." This is usually the single longest phase of a real incident, and almost nobody measures it.
Test whether your monitoring survives the failure it is supposed to detect. If your Kafka metrics pipeline (JMX exporters, Prometheus scraping, Grafana dashboards) runs on the same cluster or network path as production traffic, you lose visibility exactly when you need it most.
Test whether the person on call at 3 AM can actually authorize a failover or whether they need an approval chain that takes 30 minutes, and whether they know who to call, where the runbook lives, and what the approval process is.
The game day tip: run a chaos experiment without telling the on-call team in advance. Clear it with management first, start the clock when the fault is injected, and measure the actual time from detection to decision to execution. Then compare that number to the estimate in your DR plan.
The results are often sobering. Teams that estimated a 10-minute detection-to-decision window frequently measure 25-40 minutes when tested without warning. The gap comes down to the difference between a rehearsed scenario and the reality of being woken up at 3 AM, finding the right Slack channel, reaching the right person, explaining the situation, and getting authorization.
Key points
- An untested plan is a hypothesis. Configuration drift, runbook decay, and compounding assumptions create an RTO gap that only surfaces under pressure. The "green dashboard" tells you nothing about recovery capability.
- Chaos testing reveals what monitoring cannot. Producer timeouts silently dropping data, consumer rebalances taking 2-5x longer than expected, and error handlers swallowing failures are the three findings that surprise teams most.
- Test the decision chain, not just infrastructure. The gap between "alert fires" and "someone calls the failover API" is usually the longest phase. Teams estimating 10 minutes frequently measure 25-40.
- Resilience testing is compliance testing. DORA, SOC 2, PCI-DSS, and GDPR all require documented, measured recovery capability. A single well-documented chaos experiment produces the five artifacts auditors need.
- Traditional DR testing costs 100-200+ person-hours per test at 20 projects. Proxy-layer chaos cuts that to 40-60 hours and makes quarterly testing viable.
Every DR challenge described above shares a common structural root: there is no single point of control for Kafka client connectivity. Producers and consumers connect directly to brokers, with credentials, bootstrap servers, and configuration distributed across services, repositories, and teams. When something needs to change, there is no single place to make it happen.
The pattern that solves this is a centralized proxy that speaks the Kafka protocol. All clients connect to a single stable endpoint instead of directly to brokers, and the proxy handles cluster routing, credential management, and policy enforcement. Cluster switching happens behind it.
This pattern addresses multiple DR areas simultaneously. Client switching (Area 5) becomes a single API call. Security decoupling (Area 1) means only the proxy needs credentials for both clusters. Continuous validation (Area 6) becomes possible through proxy-layer fault injection, simulating broker errors without touching production Kafka.
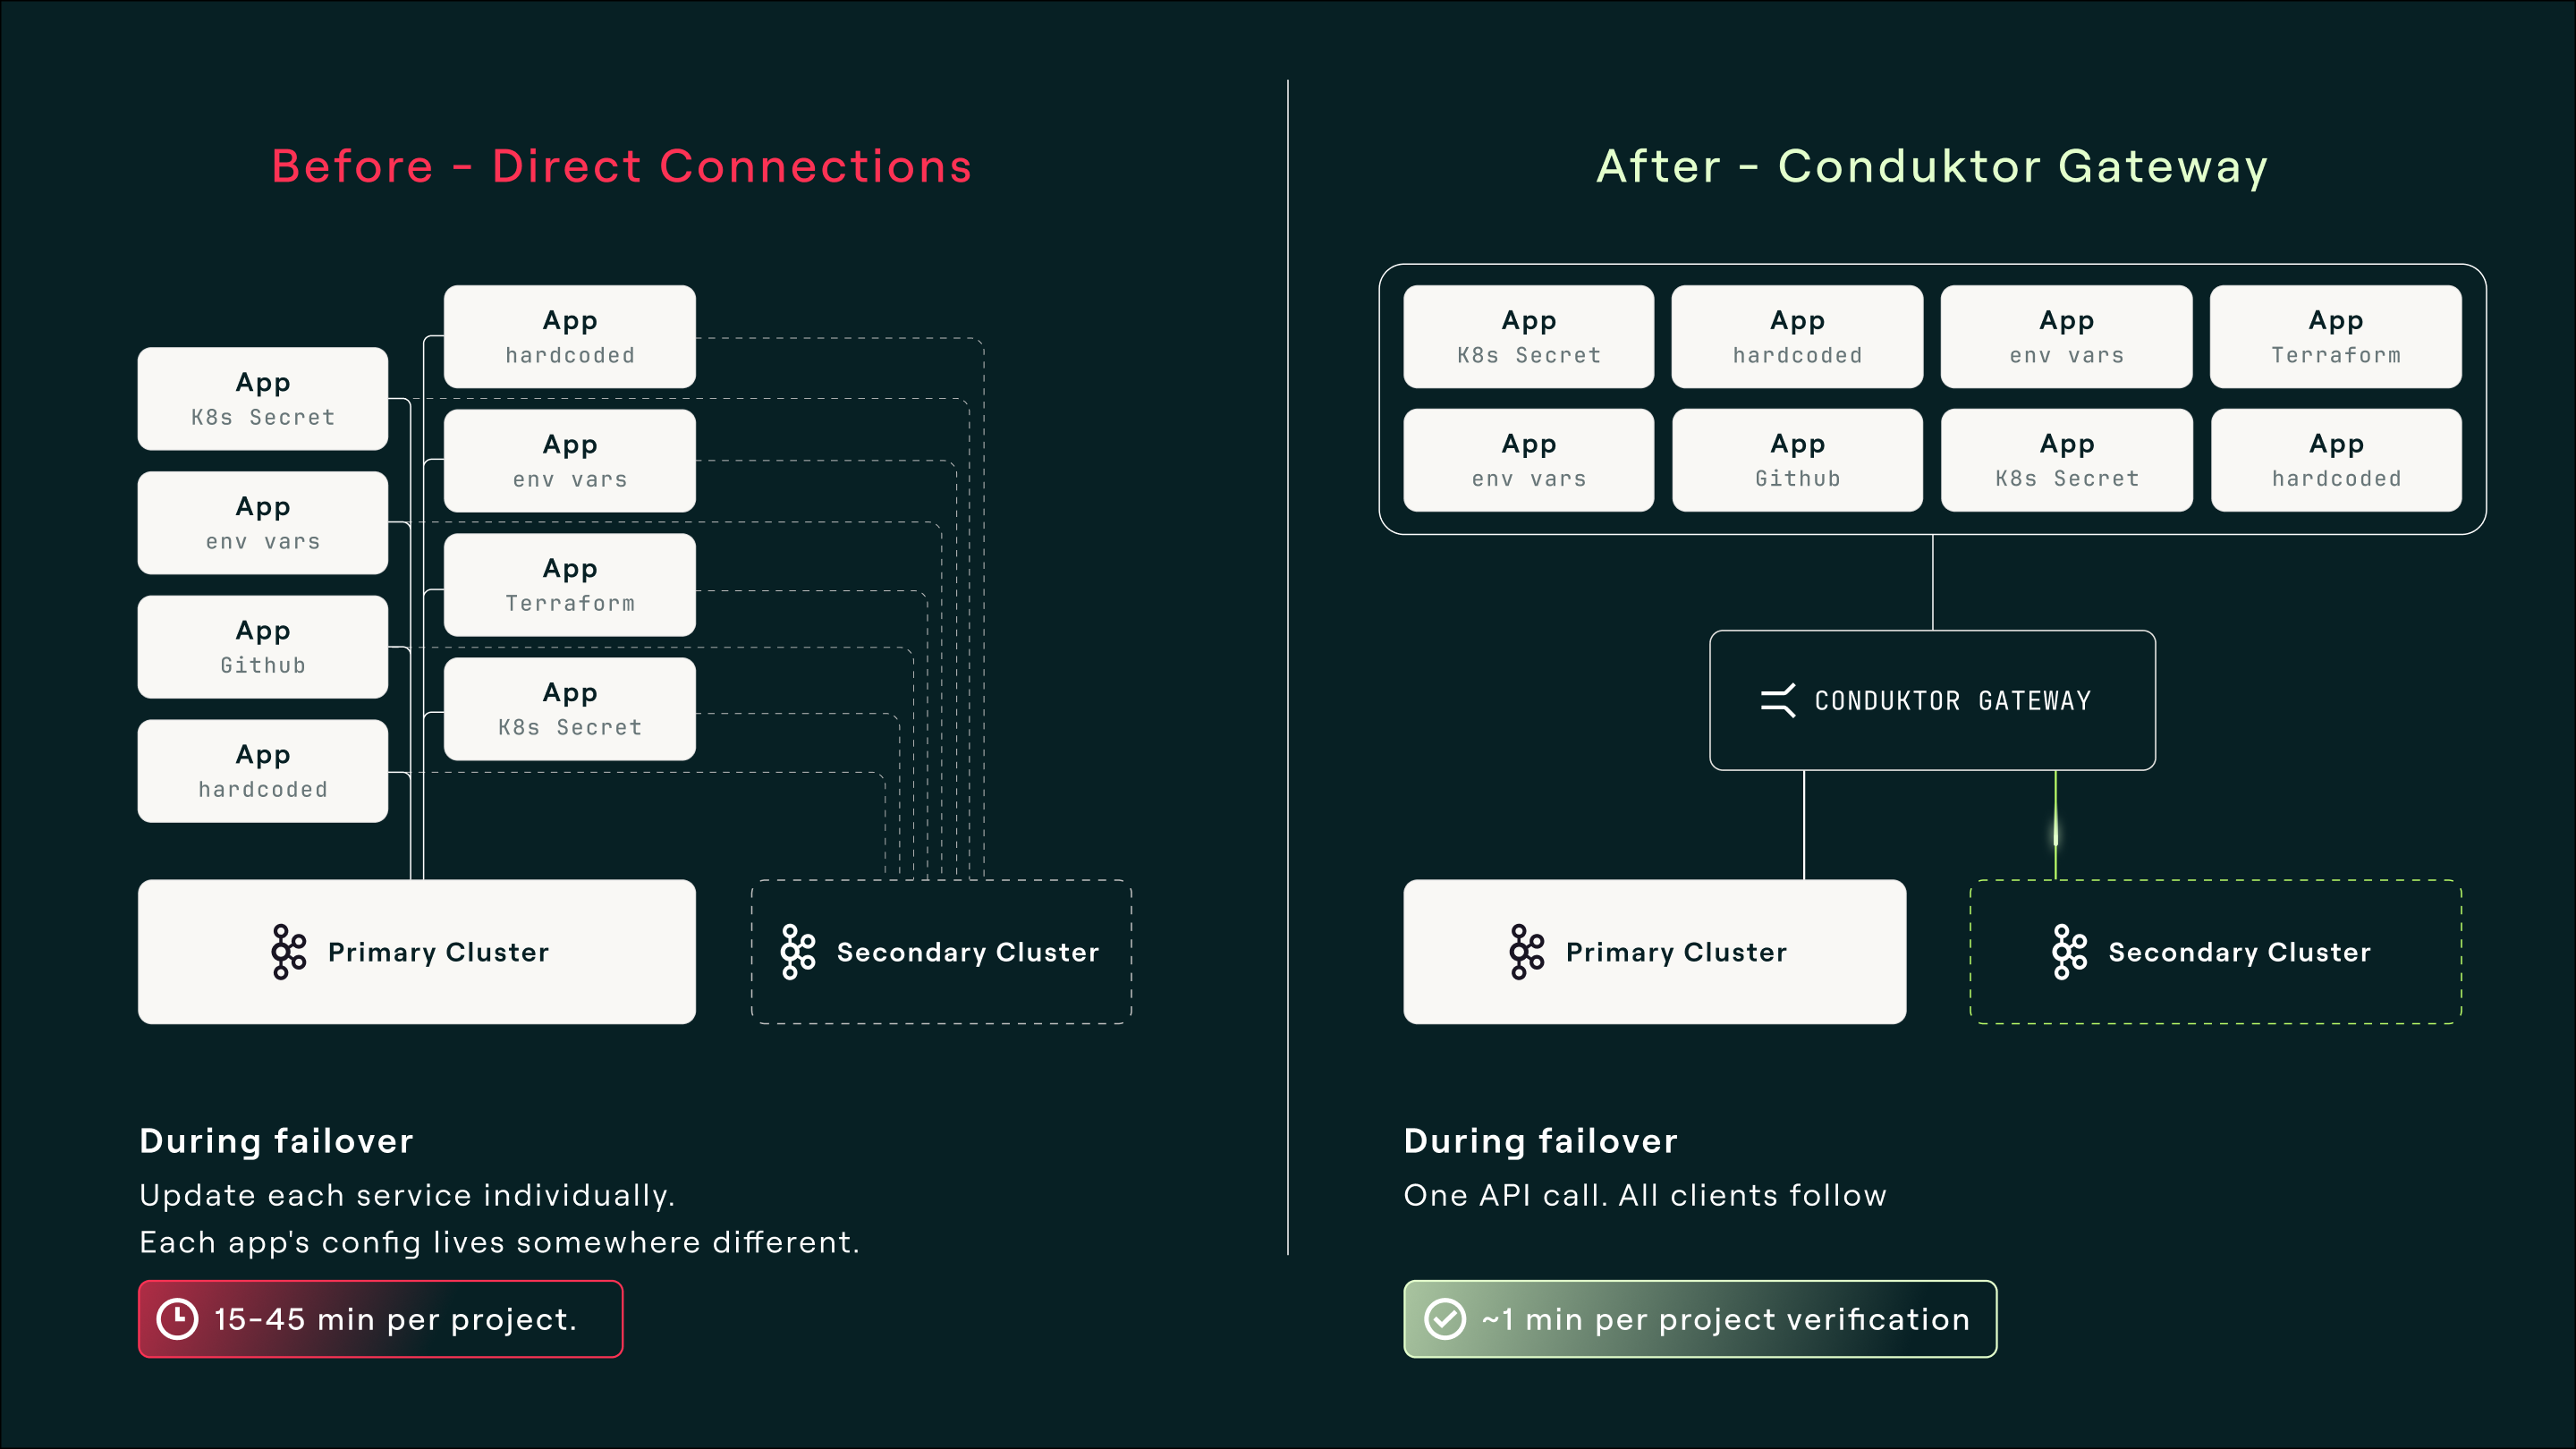
Conduktor Gateway is the implementation of this pattern. It speaks the Kafka protocol natively, with no client code changes and no special SDK. Applications connect to Gateway the same way they would connect to any Kafka cluster. Gateway is configured with both your primary and secondary clusters, routes all traffic to the primary during normal operation, and failover is one API call: Gateway closes all existing TCP connections, forcing clients to reconnect to the new cluster.
It works with any Kafka-compatible system, whether it's cloud-based on on-prem: self-hosted Apache Kafka, AWS MSK, Confluent, Aiven, Redpanda, WarpStream.
What this changes for recovery time
| Phase | Without Gateway | With Gateway |
|---|
| Infrastructure assessment | 5-15 min | 5-15 min (same) |
| DR runbook execution | 15-25 min | 15-25 min (same) |
| Per-project coordination | 15-45 min x N projects | ~1 min |
| App team action work | 75-150 min per team | 10-20 min per team (observe + verify) |
Gateway does not solve detection or replication, which remain your responsibility. The fixed costs of infrastructure assessment and runbook execution also remain. What it eliminates is the per-project coordination and action work that dominates RTO at scale, so that recovery time barely grows with project count instead of scaling linearly.
Total recovery time by number of critical projects

Detecting failures, replicating data, and deciding when to pull the trigger are still hard. The scramble afterward is what goes away.
Consider a composite drawn from patterns we have seen across organizations adopting this approach.
A mid-size financial services company with 60+ services on Kafka across two regions, processing payment transactions and regulatory reporting through Kafka pipelines.
They started where most organizations start: active-passive setup with MirrorMaker 2, replication running, runbook documented, tested once two years ago. The platform team estimated their RTO at 30 minutes.
When they ran their first structured chaos experiment, the findings were typical. ACLs had drifted between clusters. Three services had hardcoded bootstrap servers that were not in the runbook. Their monitoring dashboard depended on the primary cluster's metrics pipeline, and credential management differed between clusters. Their measured RTO was over 3 hours, driven almost entirely by per-project coordination. At 30 minutes of platform coordination per critical project across 18 projects, plus 2 hours of app team action work per team, the coordination and execution dwarfed the 20-minute infrastructure runbook.
Annual DR testing was consuming 100+ person-hours per test, so they tested once a year at best, which meant drift accumulated unchecked between tests.
After adopting a centralized gateway pattern, they moved to quarterly chaos testing with proxy-layer fault injection, dropping per-team test participation from 6 hours to under 2 hours and documenting experiments for their upcoming DORA compliance audit.
The result: sub-15-minute measured recovery time. Infrastructure assessment plus runbook execution plus roughly one minute per project for verification. Quarterly chaos experiments generating both engineering insights and compliance evidence at a fraction of the previous testing cost. The last failover drill was, in one engineer's words, "boring," with one person making one API call and validating in minutes.
The real investment was the decision to stop treating DR as a checkbox and start treating it as an operational discipline. The gateway made that discipline economically viable at their scale.
The economics of DR testing at scale
| Traditional DR testing | With Gateway |
|---|
| Per-team time per test | 4-8 hours | 1.5-2.5 hours |
| Platform coordination per team | 1-3 hours | 25-40 minutes |
| Total person-hours at 20 projects | 100-200+ hours | 40-60 hours |
| Achievable testing frequency | Annual | Quarterly |
The same architecture that simplifies failover also enables the chaos testing methodology from Part 3. Proxy-layer fault injection lets you simulate broker errors, latency, leader elections, and schema failures without touching production Kafka, scoped to specific workloads.
The goal is that when Kafka does fail (and it will, because distributed systems fail) recovery is a calm, sequenced, well-practiced procedure. Boring, in the best possible way.
For a step-by-step walkthrough of this pattern in engineering terms, see How Gateway Reduces Kafka DR from Hours to Minutes. For the product view with configuration, customer outcomes, and FAQs, see the Disaster Recovery and Failover use case page.
Key points
- The root cause of slow recovery is fragmented client connectivity. No single point of control means failover requires touching every service individually.
- A centralized gateway eliminates per-project coordination. One switch, all applications fail over together. Recovery time barely grows with project count instead of scaling linearly.
- The fixed costs remain. Detection, replication, and the decision to fail over are still your responsibility. What goes away is the scramble afterward.
- Measured results: sub-15-minute recovery. Organizations using this pattern report infrastructure assessment plus runbook execution plus roughly one minute per project for verification.
- The same architecture enables continuous validation. Proxy-layer fault injection lets you run chaos experiments without touching production Kafka, making quarterly testing economically viable.
Bring this to your next design review or DR audit. For each of the six areas, ask three questions: Have you addressed it? Have you tested it? When was the last time you verified it?
Signs you are on track: Wave 1 applications are defined and explicitly documented. Quarterly chaos experiments are running against critical workloads. Your measured RTO matches your targets (not your estimates, your measurements). Compliance evidence builds automatically from your testing cadence.
Signs you have work to do: The runbook was last updated more than six months ago, there is no chaos testing cadence, your RTO is an estimate rather than a measurement, the security posture on your secondary cluster has not been verified this quarter, or the person who designed your DR architecture has left the team and nobody has reviewed the plan since.
Most teams fall somewhere in between. The Disaster Recovery Readiness Checklist scores your current state across all six technical areas and gives you a structured way to identify where the gaps are and which ones matter most for your risk profile.
Six questions to bring to your team this week
1. When was the last time we tested failover end-to-end? Not reviewed the runbook, but actually executed it?
2. Can the person on call at 3 AM authorize a failover without an approval chain? Do they know they can?
3. Do we know the actual rebalance time for our largest consumer group under failure conditions?
4. Have we verified that ACLs, schemas, and credentials on the secondary cluster match production today, not six months ago?
5. If we had to fail over right now, how many teams would we need to coordinate with? How long would that take?
6. Is our delivery.timeout.ms longer than our expected detection-and-decision window?
Kafka disaster recovery is a solvable problem. The infrastructure piece, replication, is mature and well-understood. The organizational piece, coordination under pressure, is where most teams get stuck, but the pattern for fixing it is clear: centralize client connectivity, validate continuously, and treat recovery as a measured capability rather than an untested plan.
None of this requires rearchitecting your Kafka deployment or rewriting your applications. It requires deciding that DR is an operational discipline worth investing in, then working through the six areas methodically. Start with the gaps that carry the most risk for your organization, test your assumptions with a real chaos experiment, and use the results to build the case for whatever comes next. The teams that recover in minutes got there incrementally, not all at once.
Published by Conduktor. For more on Kafka disaster recovery, visit conduktor.io.