Log Aggregation with Kafka
Log aggregation is a core requirement for operating distributed systems at scale. As applications move from monoliths to microservices, collecting and centralizing logs from dozens or hundreds of services becomes critical for debugging, monitoring, and compliance.
Apache Kafka is a popular backbone for log aggregation pipelines, offering durability, scalability, and real-time processing capabilities that traditional approaches lack. For foundational knowledge of Kafka's architecture, see Apache Kafka. 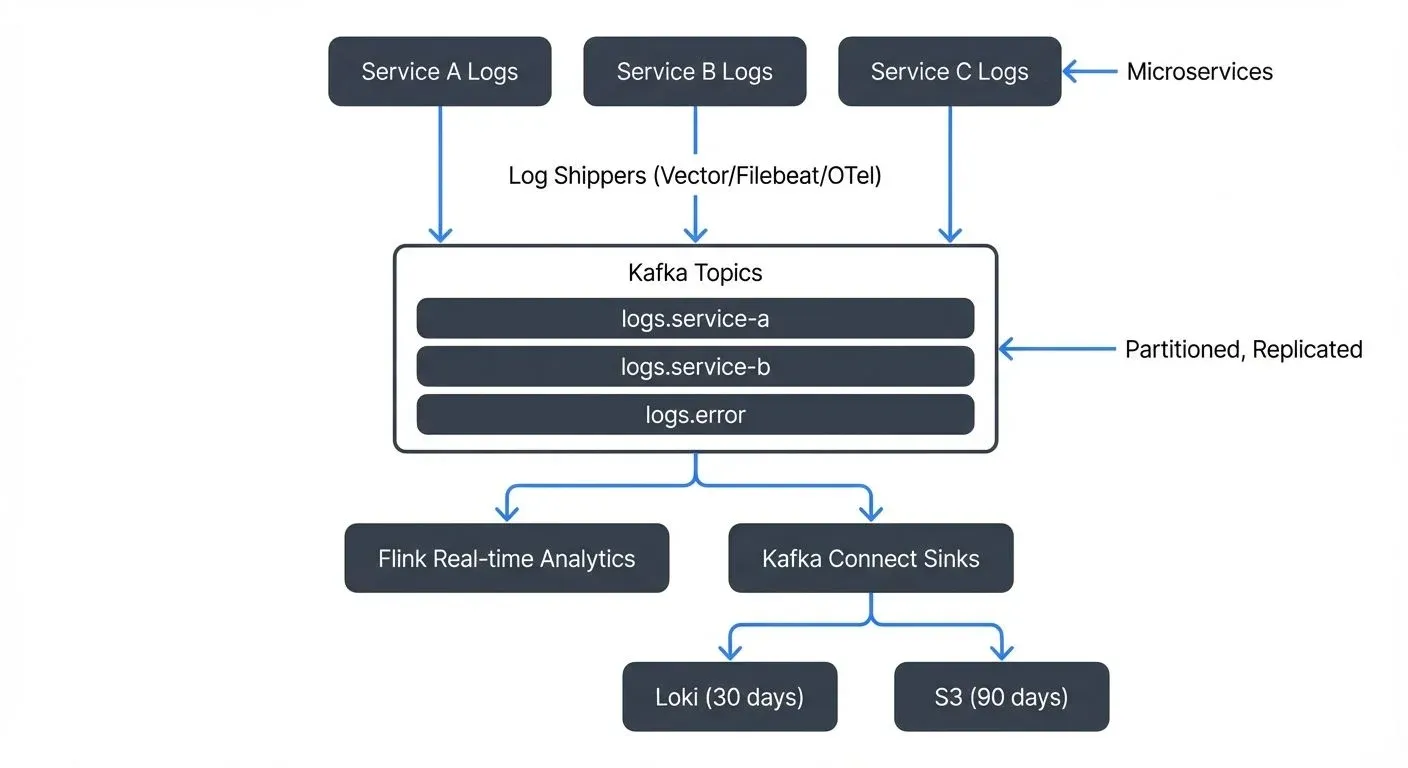
What is Log Aggregation?
Log aggregation is the process of collecting log data from multiple sources across a distributed system and centralizing it for analysis, monitoring, and long-term storage. Every application component, whether a web server, database, or microservice, generates logs that contain valuable information about system behavior, errors, performance metrics, and security events.
In a traditional monolithic application running on a single server, logs might simply write to local files that administrators can tail or grep. However, modern distributed systems require a more sophisticated approach. Log aggregation systems must handle high throughput (often millions of log events per second), provide reliable delivery guarantees, enable real-time analysis, and support multiple consumers with different processing needs.
The goal is not just to collect logs, but to make them actionable. This means routing different log types to appropriate destinations, enabling both real-time alerting and historical analysis, and maintaining enough context to trace requests across service boundaries. Modern log aggregation increasingly integrates with distributed tracing systems (like OpenTelemetry) to correlate logs with traces and metrics, providing complete observability.
Why Traditional Log Aggregation Falls Short
Traditional log aggregation typically relies on agents that tail log files and forward them to a central server or storage system. While this approach works for small-scale deployments, it reveals significant limitations as systems grow.
- Scalability bottlenecks emerge when a central log server becomes overwhelmed by the volume of incoming logs. Vertical scaling only delays the problem. Additionally, file-based collection introduces latency, logs must be written to disk before being read and forwarded, creating delays that make real-time analysis difficult.
- Reliability concerns plague traditional systems. If the central log server goes down, logs may be lost or buffered locally until disk space runs out. There's often no guarantee of delivery, and recovering from failures can be complex.
- Inflexibility becomes apparent when multiple teams need access to the same log data. Traditional systems typically support a single consumer pattern, logs go to one destination. If the security team needs access to audit logs while the operations team wants to feed them into a monitoring system, you end up duplicating log streams or building complex custom routing logic.
These limitations led companies like LinkedIn to create Apache Kafka, originally built to solve log aggregation at scale.
How Kafka Enables Modern Log Aggregation
Apache Kafka addresses the shortcomings of traditional log aggregation through its distributed, append-only commit log architecture. At its core, Kafka treats logs as ordered streams of events that can be reliably stored and replayed. With Kafka 4.0+ running in KRaft mode (eliminating the ZooKeeper dependency), modern deployments benefit from simplified operations, faster metadata propagation, and support for millions of partitions.
- Distributed scalability is built into Kafka's design. Topics are partitioned across multiple brokers (Kafka servers that store and serve data), allowing horizontal scaling of both storage and throughput. As log volume grows, you can add more brokers and partitions to handle the load. Each partition is an ordered log that can be consumed independently, enabling parallel processing. Modern Kafka clusters routinely handle millions of log events per second across thousands of topics.
- Durability and reliability come from Kafka's replication model. Every partition can be replicated across multiple brokers, ensuring logs survive individual machine failures. Producers receive acknowledgments confirming that data has been safely replicated before considering a write successful. With tiered storage (available in Kafka 3.6+), you can retain logs cost-effectively by moving older data to object storage while keeping recent logs on local disks for low-latency access.
- Multi-consumer support is native to Kafka. Multiple consumer groups (independent sets of consumers that track their own reading position) can read from the same log topic simultaneously without interfering with each other. The operations team can stream logs to their monitoring system, while the security team sends the same logs to their SIEM, and the data team archives everything to object storage, all consuming from the same Kafka topic at their own pace.
- Decoupling is another key benefit. Producers (your applications) don't need to know about consumers (your log processing systems). You can add new log consumers, upgrade existing ones, or temporarily take them offline without impacting log production.
Architecture Patterns for Kafka-Based Log Aggregation
A typical Kafka log aggregation architecture consists of several layers, each with specific responsibilities.
- Log producers are the applications and services generating logs. Rather than writing to local files, applications can use Kafka client libraries to send log events directly to Kafka topics. Alternatively, log shippers like Vector, Filebeat, or Fluentd can tail existing log files and forward them to Kafka, useful when modifying application code isn't feasible. Vector (written in Rust) has emerged as a modern, high-performance alternative with excellent resource efficiency and rich transformation capabilities. For cloud-native environments, OpenTelemetry Collector provides unified log, trace, and metric collection with consistent semantic conventions.
- Topic organization requires thoughtful design. Common patterns include:
- Separate topics per service (e.g.,
logs.checkout-service,logs.payment-service) - Topics organized by log level (e.g.,
logs.error,logs.info) - Topics based on log type (e.g.,
logs.access,logs.application,logs.audit)
The choice depends on consumption patterns. If different teams consume different services' logs, service-based topics make sense. If you want to route all ERROR-level logs to a paging system regardless of source, level-based topics may be better. For comprehensive guidance on topic design decisions, see Kafka Topic Design Guidelines.
- Partitioning strategy impacts both performance and ordering guarantees. Partitioning by service instance ID ensures logs from a specific instance remain ordered, which helps with debugging. Partitioning by user ID or trace ID (a unique identifier that tracks a request across multiple services) can keep related logs together, making distributed tracing more effective. When using OpenTelemetry, the trace context is automatically propagated through log fields, enabling powerful correlation between logs, traces, and metrics.
- Log consumers process the log streams. Common consumer patterns include:
- Stream processors like Apache Flink 1.20+ or Kafka Streams that analyze logs in real-time, detecting anomalies or calculating metrics
- Connectors (Kafka Connect) that sink logs to storage backends like Elasticsearch, Grafana Loki, ClickHouse, S3, or databases
- OpenTelemetry Collector consuming from Kafka to forward logs to observability platforms
- Custom applications that trigger alerts or update dashboards based on log patterns
Storage backends have evolved significantly. While Elasticsearch remains popular for full-text search, Grafana Loki offers a more cost-effective alternative optimized for log aggregation with excellent Prometheus integration. ClickHouse provides exceptional query performance for log analytics at scale. Many organizations use a hybrid approach: Loki or ClickHouse for recent logs (last 30 days), with older logs archived to S3 via Kafka Connect for long-term retention and compliance.
Consider a concrete example: an e-commerce platform with dozens of microservices. Each service sends structured JSON logs to a service-specific Kafka topic using OpenTelemetry SDKs, which automatically include trace and span IDs. A Flink application (Flink 1.20+) consumes all topics, extracts error events using pattern matching, and writes them to an errors.critical topic that triggers PagerDuty alerts. Meanwhile, a Kafka Connect S3 sink consumes all logs and archives them to object storage for compliance. A Kafka Connect Loki sink provides full-text search capabilities for debugging sessions with 30-day retention. All three consumers operate independently, at their own pace, from the same source data.
Practical Implementation Example
Here's a simple example of sending structured logs directly to Kafka using the Java producer:
import org.apache.kafka.clients.producer.*;
import com.fasterxml.jackson.databind.ObjectMapper;
import java.util.*;

public class KafkaLogProducer {
    private final Producer<String, String> producer;
    private final String topic;
    private final ObjectMapper mapper = new ObjectMapper();

    public KafkaLogProducer(String bootstrapServers, String topic) {
        Properties props = new Properties();
        props.put(ProducerConfig.BOOTSTRAP_SERVERS_CONFIG, bootstrapServers);
        props.put(ProducerConfig.KEY_SERIALIZER_CLASS_CONFIG,
                  "org.apache.kafka.common.serialization.StringSerializer");
        props.put(ProducerConfig.VALUE_SERIALIZER_CLASS_CONFIG,
                  "org.apache.kafka.common.serialization.StringSerializer");
        props.put(ProducerConfig.ACKS_CONFIG, "all"); // Wait for all replicas
        props.put(ProducerConfig.COMPRESSION_TYPE_CONFIG, "snappy"); // Compress logs

        this.producer = new KafkaProducer<>(props);
        this.topic = topic;
    }

    public void logEvent(String level, String message, Map<String, Object> context) {
        try {
            Map<String, Object> logEntry = new HashMap<>();
            logEntry.put("timestamp", System.currentTimeMillis());
            logEntry.put("level", level);
            logEntry.put("message", message);
            logEntry.put("service", "checkout-service");
            logEntry.put("context", context);

            String jsonLog = mapper.writeValueAsString(logEntry);

            ProducerRecord<String, String> record =
                new ProducerRecord<>(topic, level, jsonLog);

            producer.send(record, (metadata, exception) -> {
                if (exception != null) {
                    System.err.println("Failed to send log: " + exception.getMessage());
                }
            });
        } catch (Exception e) {
            System.err.println("Error creating log entry: " + e.getMessage());
        }
    }

    public void close() {
        producer.close();
    }
}

// Usage
Map<String, Object> context = new HashMap<>();
context.put("userId", "user-12345");
context.put("orderId", "order-67890");
context.put("traceId", "trace-abc123"); // For distributed tracing

logProducer.logEvent("ERROR", "Payment processing failed", context);
For production use with OpenTelemetry integration, consider using the OpenTelemetry Log4j2 or Logback appender, which automatically handles trace context propagation and provides consistent semantic conventions:
<!-- Log4j2 configuration with OpenTelemetry and Kafka appender -->
<Configuration status="WARN">
    <Appenders>
        <Kafka name="KafkaAppender" topic="logs.checkout-service">
            <Property name="bootstrap.servers">kafka-broker:9092</Property>
            <Property name="compression.type">snappy</Property>
            <PatternLayout pattern="%d{ISO8601} %-5p [%t] %c{1} - %m%n"/>
            <JsonTemplateLayout eventTemplateUri="classpath:OtelLayout.json"/>
        </Kafka>
    </Appenders>
    <Loggers>
        <Root level="info">
            <AppenderRef ref="KafkaAppender"/>
        </Root>
    </Loggers>
</Configuration>
This configuration automatically includes OpenTelemetry trace context in each log entry, enabling correlation with distributed traces.
Real-World Implementation Considerations
Successfully implementing Kafka-based log aggregation requires attention to several practical details.
- Schema design is crucial. Structured logs (JSON or Avro) enable rich querying and processing compared to unstructured text. Define a consistent schema that includes standard fields like timestamp, service name, log level, message, and trace context. OpenTelemetry provides well-defined semantic conventions for log fields, ensuring consistency across services and compatibility with observability tools. Using Schema Registry (7.0+) helps enforce consistency and enables schema evolution as requirements change. Avro is particularly useful for log data as it provides compact binary encoding, reducing network and storage costs significantly compared to JSON. For details on schema management, see Schema Registry and Schema Management and Message Serialization in Kafka.
- Retention policies balance storage costs with debugging needs. Kafka can retain logs for hours, days, or weeks depending on disk capacity. With tiered storage (Kafka 3.6+), you can extend retention dramatically by offloading older log segments to object storage (S3, GCS, Azure Blob) while maintaining transparent access through Kafka's consumer API. Configure retention based on how far back you need to investigate issues, typically 7-30 days in hot storage (local disks) and 90+ days in cold storage (object storage) for compliance and deep analysis. For comprehensive coverage of tiered storage, see Tiered Storage in Kafka.
- Volume management prevents runaway log production from overwhelming the system. Implement sampling for high-volume debug logs while keeping all errors and warnings. Use quotas to limit how much data individual producers can send, protecting shared infrastructure from misbehaving services. For quota implementation details, see Quotas and Rate Limiting in Kafka.
- Monitoring the monitor is essential. Track metrics like producer send latency, consumer lag, and broker disk usage. Lag in log consumers might mean alerts aren't firing in real-time or logs aren't being archived properly. Tools like Conduktor provide comprehensive visibility into Kafka-based log pipelines, including consumer lag monitoring (Monitoring Guide), topic health (Topics), throughput metrics, and schema registry management. This operational visibility is critical for maintaining reliable log aggregation at scale. For detailed strategies on tracking consumer lag, see Consumer Lag Monitoring.
- Security considerations include encrypting logs in transit and at rest, especially for logs containing sensitive information. Use authentication and authorization to control which services can produce logs to which topics, and which teams can consume them. For comprehensive security guidance, see Kafka Security Best Practices. Since logs often contain audit information, also consider the patterns in Audit Logging for Streaming Platforms.
Integration with the Modern Observability Ecosystem
Kafka-based log aggregation doesn't exist in isolation, it integrates with a broader ecosystem of tools and platforms.
- OpenTelemetry integration has become the standard approach for modern log aggregation. OpenTelemetry provides SDKs for instrumenting applications to emit logs with consistent semantic conventions, including automatic trace context propagation. The OpenTelemetry Collector can receive logs from applications, process and enrich them, and export to Kafka topics. On the consumption side, collectors can read from Kafka and forward logs to various backends. This creates a vendor-neutral, standardized pipeline that works across cloud providers and observability platforms.
- Stream processing frameworks like Apache Flink 1.20+ and Kafka Streams enable sophisticated log analysis. Flink's advanced features like exactly-once processing, low-latency stateful operations, and SQL support make it ideal for complex log analysis scenarios. You can build applications that correlate logs across services to detect distributed failure patterns, calculate real-time statistics about error rates or latency, or enrich logs with contextual information from other data sources. For choosing between stream processing frameworks, see Kafka Streams vs Apache Flink, and for detailed Flink capabilities, refer to What is Apache Flink: Stateful Stream Processing.
- Modern log backends have diversified beyond Elasticsearch. Grafana Loki provides a Prometheus-inspired approach optimized for log aggregation, indexing only metadata rather than full text content for cost efficiency. ClickHouse offers columnar storage with exceptional query performance for log analytics at massive scale. These backends typically consume logs from Kafka via dedicated connectors or custom consumers.
- Hybrid architectures remain common during transitions. Logstash can consume from Kafka topics and transform logs before sending to Elasticsearch. Fluentd and Vector support Kafka as both input and output, enabling gradual migration from file-based collection. Vector's transformation capabilities make it particularly useful for normalizing logs from diverse sources before sending to Kafka.
- Observability platforms increasingly support Kafka as a log source. Many APM and logging SaaS products can consume directly from Kafka topics, or you can use their agents to forward logs through Kafka for centralized control before they reach the vendor platform. This "Kafka in the middle" pattern provides flexibility to change vendors or add new consumers without modifying applications.
- Data governance and operational management become critical as log pipelines scale. Conduktor provides comprehensive capabilities for managing Kafka-based log infrastructure, including topic discovery, schema validation, consumer lag monitoring, data quality checks, and access control. As log pipelines grow to hundreds of topics and dozens of consumer applications, having centralized visibility and governance prevents operational chaos and ensures teams can troubleshoot issues quickly.
Summary
Log aggregation with Kafka provides a scalable, reliable foundation for observability in distributed systems. By treating logs as event streams, Kafka enables real-time processing, multiple consumers, and flexible routing while maintaining durability and ordering guarantees.
The main advantages are horizontal scalability through partitioning, reliability through replication, decoupling of producers and consumers, and support for multiple consumption patterns. KRaft mode (Kafka 4.0+), tiered storage (Kafka 3.6+), and OpenTelemetry integration have made this approach more cost-effective.
Good implementation requires decisions about topic organization, partitioning, schema design, and retention policies. Pairing Kafka with OpenTelemetry for collection, Apache Flink or Kafka Streams for processing, and backends like Grafana Loki or ClickHouse for storage produces a complete pipeline for both operational and analytical needs.
The 2025 log aggregation landscape emphasizes:
- Standardization through OpenTelemetry for consistent log formats and trace correlation
- Cost efficiency through tiered storage and optimized backends like Loki
- Operational visibility through platforms like Conduktor for monitoring and governance
- Performance with modern collectors like Vector and processors like Flink 1.20+
Kafka-based log aggregation is particularly valuable when operating microservices architectures, handling high log volumes (millions of events per second), requiring real-time log analysis, or needing multiple teams to consume the same log data independently. For simpler use cases with low volume and a single consumer, traditional approaches may suffice.
As systems grow and log data becomes central to operations, security, and business intelligence, Kafka's streaming model scales with your organization.
Related Concepts
- Apache Kafka - Distributed streaming platform for log aggregation
- Kafka Connect: Building Data Integration Pipelines - Integrate log data with storage and analytics systems
- Consumer Lag Monitoring - Track log consumer health and processing performance
Related Topics
For deeper understanding of related concepts, explore these articles:
- Apache Kafka - Foundational Kafka architecture and concepts
- Kafka Topic Design Guidelines - Best practices for organizing log topics
- Consumer Lag Monitoring - Tracking log consumer health
- Kafka Security Best Practices - Securing log data in transit and at rest
- Audit Logging for Streaming Platforms - Patterns for audit log collection
- Tiered Storage in Kafka - Cost-effective long-term log retention
- Kafka Streams vs Apache Flink - Choosing stream processors for log analysis
- What is Apache Flink: Stateful Stream Processing - Advanced log processing capabilities
- Schema Registry and Schema Management - Managing structured log schemas
- Message Serialization in Kafka - Choosing log serialization formats
- Quotas and Rate Limiting in Kafka - Controlling log volume
- Understanding KRaft Mode in Kafka - Modern Kafka deployment without ZooKeeper
- What is Data Observability: The Five Pillars - Broader observability context
Sources and References
- Apache Kafka Documentation - Log Retention and Cleanup
- Apache Kafka 4.0 Documentation - KRaft Mode
- Apache Kafka 3.6+ Documentation - Tiered Storage
- The Log: What every software engineer should know about real-time data's unifying abstraction - Jay Kreps, LinkedIn Engineering
- OpenTelemetry Documentation - Logs
- OpenTelemetry Semantic Conventions
- Grafana Loki Documentation
- Apache Flink 1.20 Documentation
- Vector Documentation
- Martin Kleppmann - Designing Data-Intensive Applications - Chapter on Stream Processing and Log-based Architectures
Written by Stéphane Derosiaux · Last updated May 12, 2026